The Self-Improving Log Analyzer – How an Agentic-Net Learns to Debug Your System
What if your log analysis system got smarter every time it investigated an error? Not through code changes or rule updates — but by remembering what it found, scoring its own performance, and using that feedback to resolve the next identical error instantly. This is the story of a 19-place, 12-transition Agentic-Net that investigates production logs, extracts reusable patterns, and crystallizes AI reasoning into zero-cost instant resolutions. Built live with AgenticOS builder agents and a Telegram bot, while the net was already running.
The Problem: Log Analysis That Never Learns
Every operations team knows the drill. An alert fires at 3 AM. Someone opens Kibana, greps through logs, traces the error chain across services, finds the root cause, writes a postmortem, and goes back to sleep. Two weeks later, the exact same error pattern shows up again. Someone opens Kibana, greps through the same logs, traces the same chain…
Traditional log analysis tools — Splunk, ELK, Datadog — are excellent at searching and visualizing. But they don’t learn. Every alert starts from zero. The investigation knowledge lives in someone’s head, maybe in a Confluence page nobody reads, or in a Slack thread buried under three months of memes.
What if the system itself could remember every investigation? What if the fifth time it saw a ReserveLockEvent timeout, it didn’t need to investigate at all — because it already knew the root cause, the fix, and which service was affected?
That’s what we built. A self-improving log analyzer powered by Agentic-Nets.
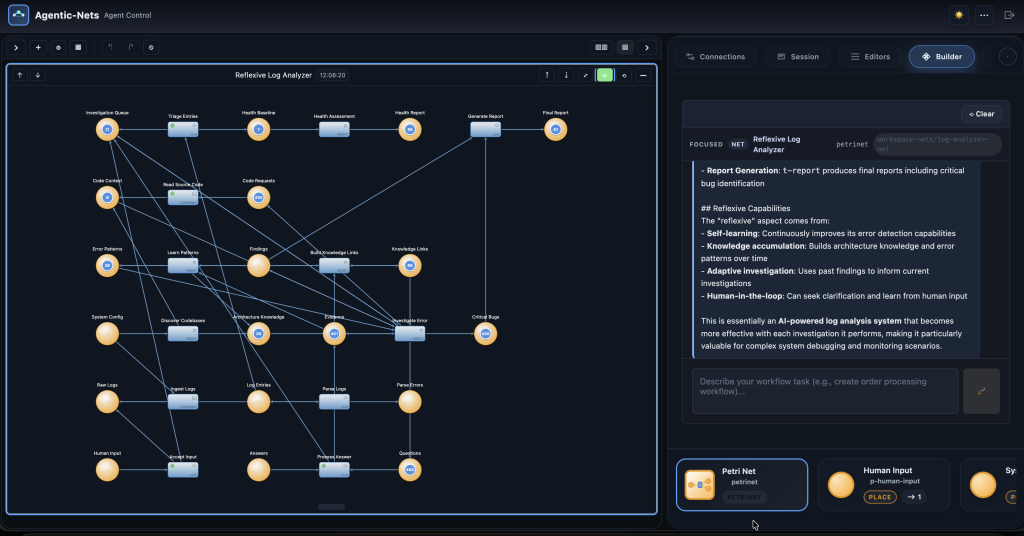
The Big Picture: Six Zones, One Learning Loop
The Log Analyzer Net is organized into six zones. Each handles a different phase of the analysis pipeline — from raw log ingestion to final reports, with a self-improving knowledge loop at its heart. Here’s the architecture:
Every log entry flows through these zones. But the magic happens in the feedback arcs — the dashed pink lines that loop learned knowledge back into the investigation. This is what turns a pipeline into a brain.
How It Works: From Raw Logs to Root Causes
Let’s walk through what happens when a new error appears in your production logs.
Step 1: Ingestion and Triage (Zone B)
Log entries arrive in p-entries. The t-triage transition — a single LLM call — classifies each entry by severity and actionability. Errors and warnings get routed to the Investigation Queue. Every entry, regardless of severity, also flows to Health Baseline for aggregate metrics.
This is catch-all routing: the actionable stuff gets investigated, but nothing gets lost.
Step 2: Deep Investigation (Zone C)
This is where Agentic-Nets show their real power. The t-investigate transition is an agent transition — not a simple function call. It’s an autonomous AI agent that reads the error, checks known patterns, requests source code if needed, and produces a root cause analysis.
The investigation agent has access to:
- The error token from
p-investigate(consumed) - Known error patterns from
p-error-patterns(read-only) - Architecture knowledge from
p-architecture(read-only) - Memory links from
p-links— quality scores and promoted patterns (read-only)
If the agent recognizes the error from a known pattern, it resolves immediately — zero LLM reasoning cycles wasted. If it’s a novel error, the agent can write a want-token back to its own input place, requesting more information. On the next poll cycle (2 seconds later), the enriched token comes back with fresh code context from the t-read-code command transition.
This want-token pattern is what makes the investigation truly autonomous. The agent controls its own depth — deciding when to dig deeper, when to ask a human, and when it has enough evidence to conclude.
Step 3: Learning and Crystallization (Zone D)
Once the investigation produces findings, two things happen simultaneously:
- t-learn (the Reflexive Brain) extracts reusable error patterns from the findings — signatures like “this exception type + this logger + this service always means X.” These patterns go to
p-error-patterns, where future investigations will read them. - t-link (the Memory Crystallization Agent) scores the investigation quality, builds a knowledge graph linking related findings, and promotes patterns that have been confirmed by multiple investigations.
The key insight: t-investigate reads what t-learn and t-link produce. This closes the feedback loop. Every investigation makes the next one faster.
The Crystallization Effect: Watching the Net Get Smarter
Here’s the part that matters to managers: the cost curve bends downward. We ran the net through two test loops with real error data and measured what happened.
In Loop 1 (baseline), the investigation agent had no prior knowledge. It took 5–7 LLM iterations to analyze each error — reading tokens, requesting code, building hypotheses, writing findings.
By Loop 2, the net had learned. When the same “Agent Max Iterations Without DONE” error appeared again, the investigation agent found it in its pattern library at 0.95 confidence and resolved it immediately. A brand-new error type (“connection-failure”) still required investigation — but even that resolved in just 4 iterations.
This is Pattern Crystallization in action. The first investigation is expensive. The fifth is cheap. The twentieth is free.
The Memory Crystallization Agent: Teaching the System to Self-Critique
Most AI systems learn what — error patterns, root causes, fix recommendations. The log analyzer goes further: it learns how well it learned.
The t-link transition is the Memory Crystallization Agent. After every batch of findings, it performs three tasks:
This is Reflexion applied to log analysis. The system doesn’t just remember root causes — it remembers how efficiently it found them, and uses that feedback to do better next time.
Built with Builder Agents and Telegram — While the Net Was Running
Here’s the part that showcases the full power of Agentic-Nets as a platform. This entire 19-place, 12-transition net was designed, deployed, tested, and iteratively improved using AgenticOS’s own tools — without ever stopping the system.
The Builder Agent: Designing Nets Through Conversation
The Designtime API lets an agent transition create places, transitions, and arcs programmatically. In practice, this means you can tell a builder agent: “Add a human interaction zone with input, questions, and answers places, connected to the investigation loop” — and the agent creates all three places, two transitions, and eight arcs in seconds.
That’s exactly how Zone F (Human Interaction) was added to this net. While t-investigate was already running and processing errors, a builder agent added p-human-input, p-questions, p-answers, t-accept-input, and t-process-answer to the live PNML — then registered the new transitions with the runtime. No restarts. No downtime. The net gained human-in-the-loop capabilities while it was actively analyzing logs.
The Telegram Bot: Operating Nets From Your Phone
The agentic-net-chat Telegram integration gives you a conversational interface to your running nets. You can:
- Seed investigation tokens: Paste a log error into the chat, and the bot routes it through
t-accept-inputdirectly into the investigation pipeline - Answer questions: When the investigation agent gets stuck and emits a question to
p-questions, the bot delivers it to your phone. Your reply goes top-answersand feeds back into the investigation - Monitor progress: Ask “how many findings so far?” and the bot queries
p-findingsandp-reportto give you a status update - Trigger transitions: Tell the bot “fire t-report” and it manually triggers the report generation
The net is a living system. You interact with it like a colleague, not a dashboard.
Live Iteration: Fix Inscriptions Without Stopping
During testing, we discovered that the t-report LLM transition timed out because the prompt was too complex. The fix? Stop the transition, re-register it with a simpler inscription, and start it again — all via API calls. The rest of the pipeline kept running. Investigations continued. Patterns accumulated. Nothing was lost.
This is the operational advantage of inscription-based architecture: the behavior is in the JSON, not in code. Change the JSON, restart the transition, done.
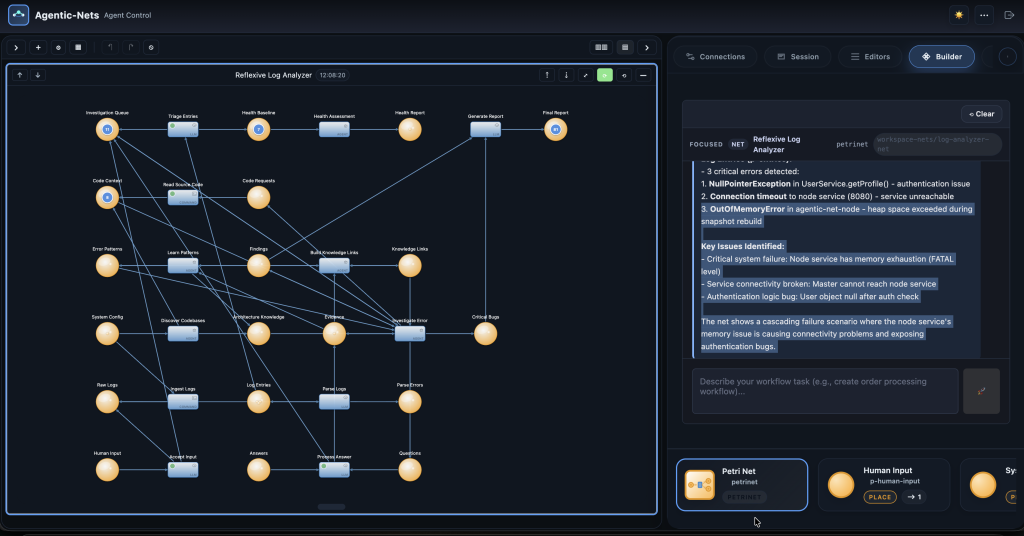
Real Numbers: What the Net Produced
After two test loops with seeded error data from a real production master service log (37 MB, 213K lines):
| Place | Token Count | What It Represents |
|---|---|---|
p-findings |
5 | Root cause analyses with severity and fix recommendations |
p-evidence |
17 | Supporting observations with confidence scores |
p-critical-bugs |
16 | Bugs requiring immediate attention |
p-error-patterns |
4 | Reusable pattern signatures for future matching |
p-links |
5 | Knowledge graph links + quality scores |
p-health-report |
11 | Per-service health assessments |
p-report |
2 | Executive summary reports |
The knowledge base grew from zero to 4 patterns, 5 knowledge links, and 4 architecture insights — all autonomously, all feeding back into future investigations.
Why This Matters: The Agentic-Net Difference
You could build a log analyzer with any orchestration framework. Airflow could run a pipeline. LangChain could call an LLM. But here’s what only Agentic-Nets give you:
The fundamental difference is memory. An Agentic-Net remembers what it investigated, how well it performed, and which patterns are reliable. It doesn’t just process data — it accumulates wisdom.
The Six Transition Types at Work
This single net uses five of AgenticOS’s six transition types, each playing to its strengths:
| Transition | Type | Why This Type |
|---|---|---|
t-triage |
LLM | Single inference call classifies severity — fast, cheap, no tools needed |
t-investigate |
Agent | Multi-step reasoning with tools (CREATE_TOKEN, THINK, DONE) — autonomous depth control |
t-learn |
Agent | Extracts patterns, uses CREATE_TOKEN for targeted emission to specific places |
t-link |
Agent | Scores quality, builds knowledge graph, promotes patterns — needs full tool access |
t-health |
Agent | Aggregates metrics across services, computes health scores with context |
t-report |
LLM | Synthesizes findings into a summary — single inference, no tools needed |
t-read-code |
Command | Reads source files via bash on the executor — deterministic, no AI cost |
t-accept-input |
LLM | Classifies human input — lightweight routing decision |
t-process-answer |
LLM | Synthesizes human answer with question context — single inference |
Notice the pattern: agent transitions handle anything requiring multi-step reasoning and tool use. LLM transitions handle simple classification and synthesis. Command transitions handle deterministic operations like reading files. Each type has a clear role, and the net chooses the right one for each job.
Where This Leads
The log analyzer is a proof of concept for a broader principle: operational systems should learn from their own operations. The same architecture applies to:
- Security monitoring: An Agentic-Net that investigates alerts, learns attack patterns, and crystallizes detection rules from incident investigations
- Customer support: Investigate support tickets, learn resolution patterns, resolve known issues instantly
- CI/CD pipelines: Analyze build failures, learn which failures are flaky vs. real, auto-triage deployment issues
- Compliance auditing: Analyze documents, learn compliance patterns, flag anomalies that match known violation signatures
Any domain where the same types of problems recur — and where human expertise is currently the bottleneck — is a candidate for a self-improving Agentic-Net.
Try It: The Inscription That Makes It All Work
The entire net behavior is defined in JSON inscriptions. Here’s the heart of it — the investigation agent inscription that makes the self-improvement loop possible:
{
  "id": "t-investigate",
  "kind": "agent",
  "mode": "SINGLE",
  "presets": {
    "investigation": {
      "placeId": "p-investigate",
      "arcql": "FROM $ LIMIT 1",
      "consume": true
    },
    "error-patterns": {
      "placeId": "p-error-patterns",
      "consume": false,
      "optional": true
    },
    "memory": {
      "placeId": "p-links",
      "consume": false,
      "optional": true
    }
  },
  "postsets": {
    "findings": { "placeId": "p-findings" },
    "evidence": { "placeId": "p-evidence" },
    "want-more": { "placeId": "p-investigate" }
  }
}
Notice the want-more postset pointing back to p-investigate. That one line creates the self-loop. And the non-consuming reads from p-error-patterns and p-links? That’s the memory feedback. The entire self-improvement architecture is encoded in 30 lines of JSON.
This article describes a live Agentic-Net built and iteratively improved on a running AgenticOS instance. The net was designed using builder agent conversations, deployed via the Designtime API, tested by seeding tokens directly into places, and refined by hot-swapping inscriptions — all without restarting any service. The knowledge base continues to grow with every investigation.
Built with AgenticOS. March 2026.