This is the complete guided tour of Agentic-Nets, the Agentic Workflow OS. It walks through the real product, screen by screen, from the public dashboard to a running multi-agent software team and the read-only monitoring view that lets anyone watch it safely. Every screenshot below was taken from a live local deployment; nothing is mocked. If you prefer to listen, the narrated video version at the end of the article covers the same tour.
The running example throughout is safe teams: a complete software team modeled as nine cooperating Petri nets, with a Product Manager, an Architect, a Developer, QA, DevOps, a Scrum Master, and a Release Train Engineer. Each role is its own net; the roles hand work to each other through shared places. By the end of the tour you will have seen how work flows through that team, and how you would build, operate, and observe a system like it yourself.
Step 1: The Dashboard, and Why This Exists
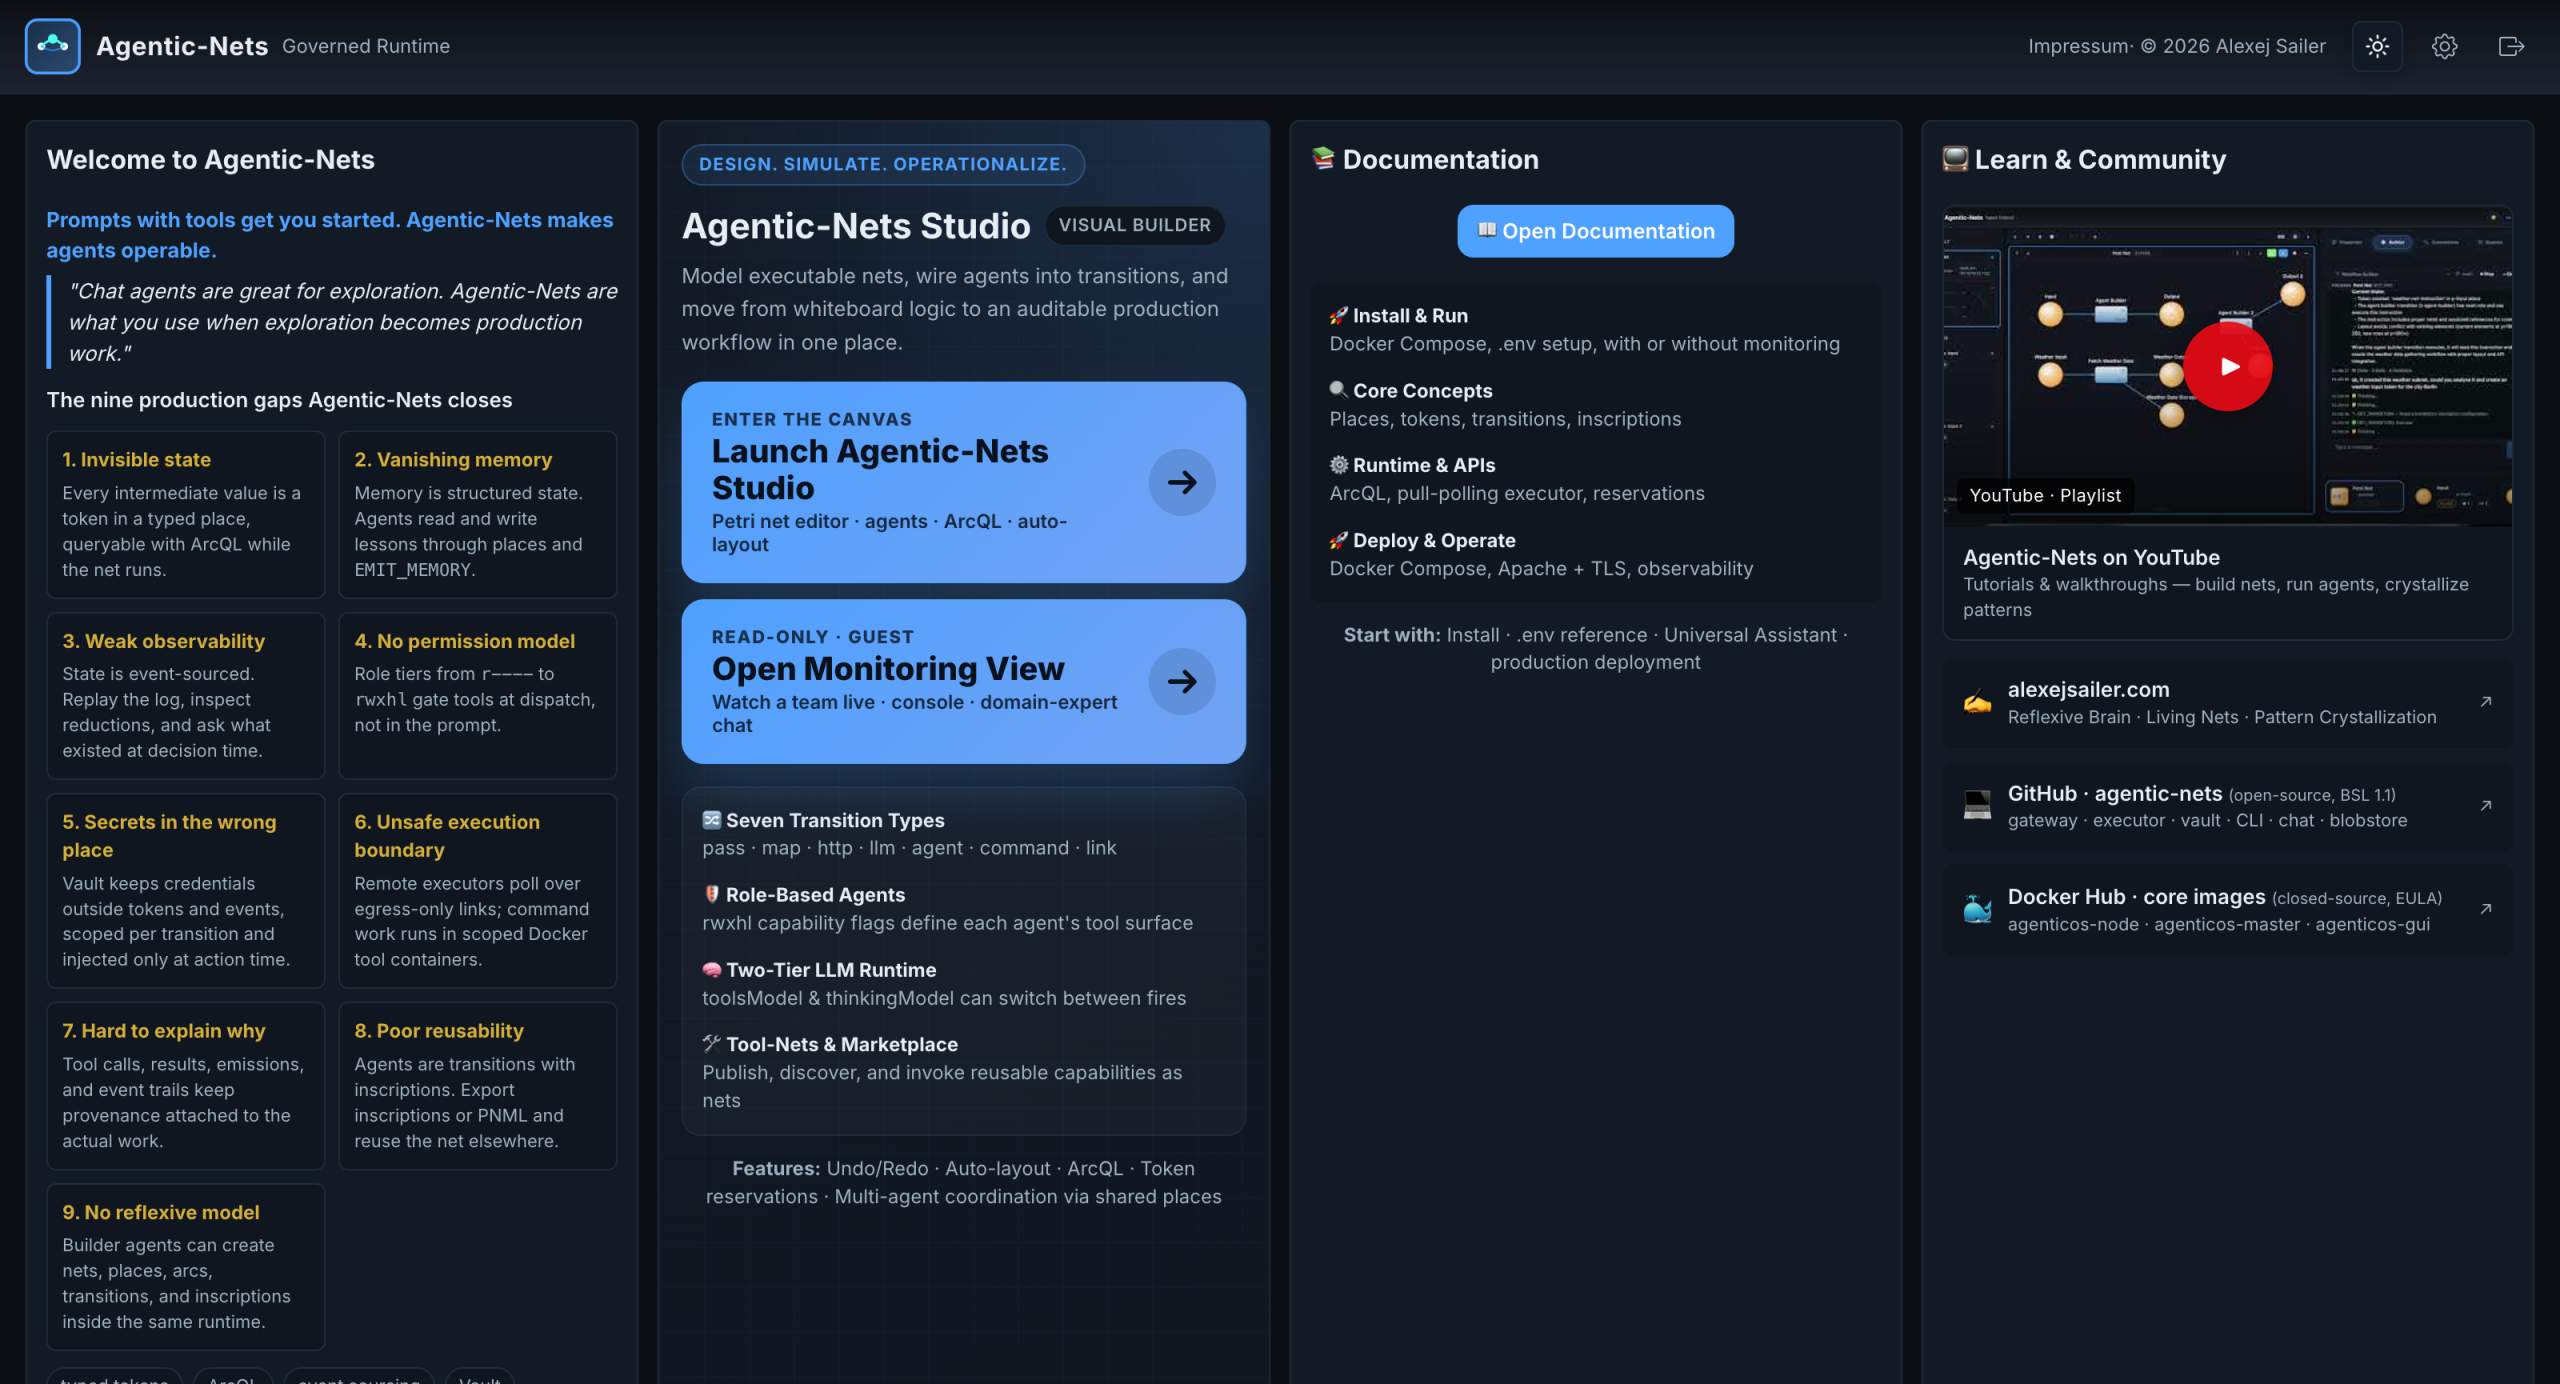
The dashboard is the front door, and it opens with the thesis in one sentence: chat agents are great for exploration, but Agentic-Nets is what you use when exploration becomes production work. The left panel lists the nine production gaps the platform closes, and they are worth reading as a map of everything you will see in this tour:
- Invisible state becomes typed tokens in places, queryable with ArcQL while the net runs.
- Vanishing memory becomes structured state that agents read and write through places.
- Weak observability becomes event-sourced history: replay the log and ask what existed at decision time.
- No permission model becomes capability role tiers that gate tools at dispatch, not in the prompt.
- Secrets in the wrong place becomes a Vault that injects credentials only at action time.
- Unsafe execution boundary becomes remote executors polling over egress-only links.
- Hard to explain why becomes provenance attached to every tool call and emission.
- Poor reusability becomes exportable inscriptions and PNML you can reuse elsewhere.
- No reflexive model becomes builder agents that create nets inside the same runtime.
The center column offers the two entrances we will use: Launch Agentic-Nets Studio, the full visual builder, and Open Monitoring View, a read-only window for guests. We will take the Studio first and come back for monitoring at the end.
Step 2: Documentation, No Login Required
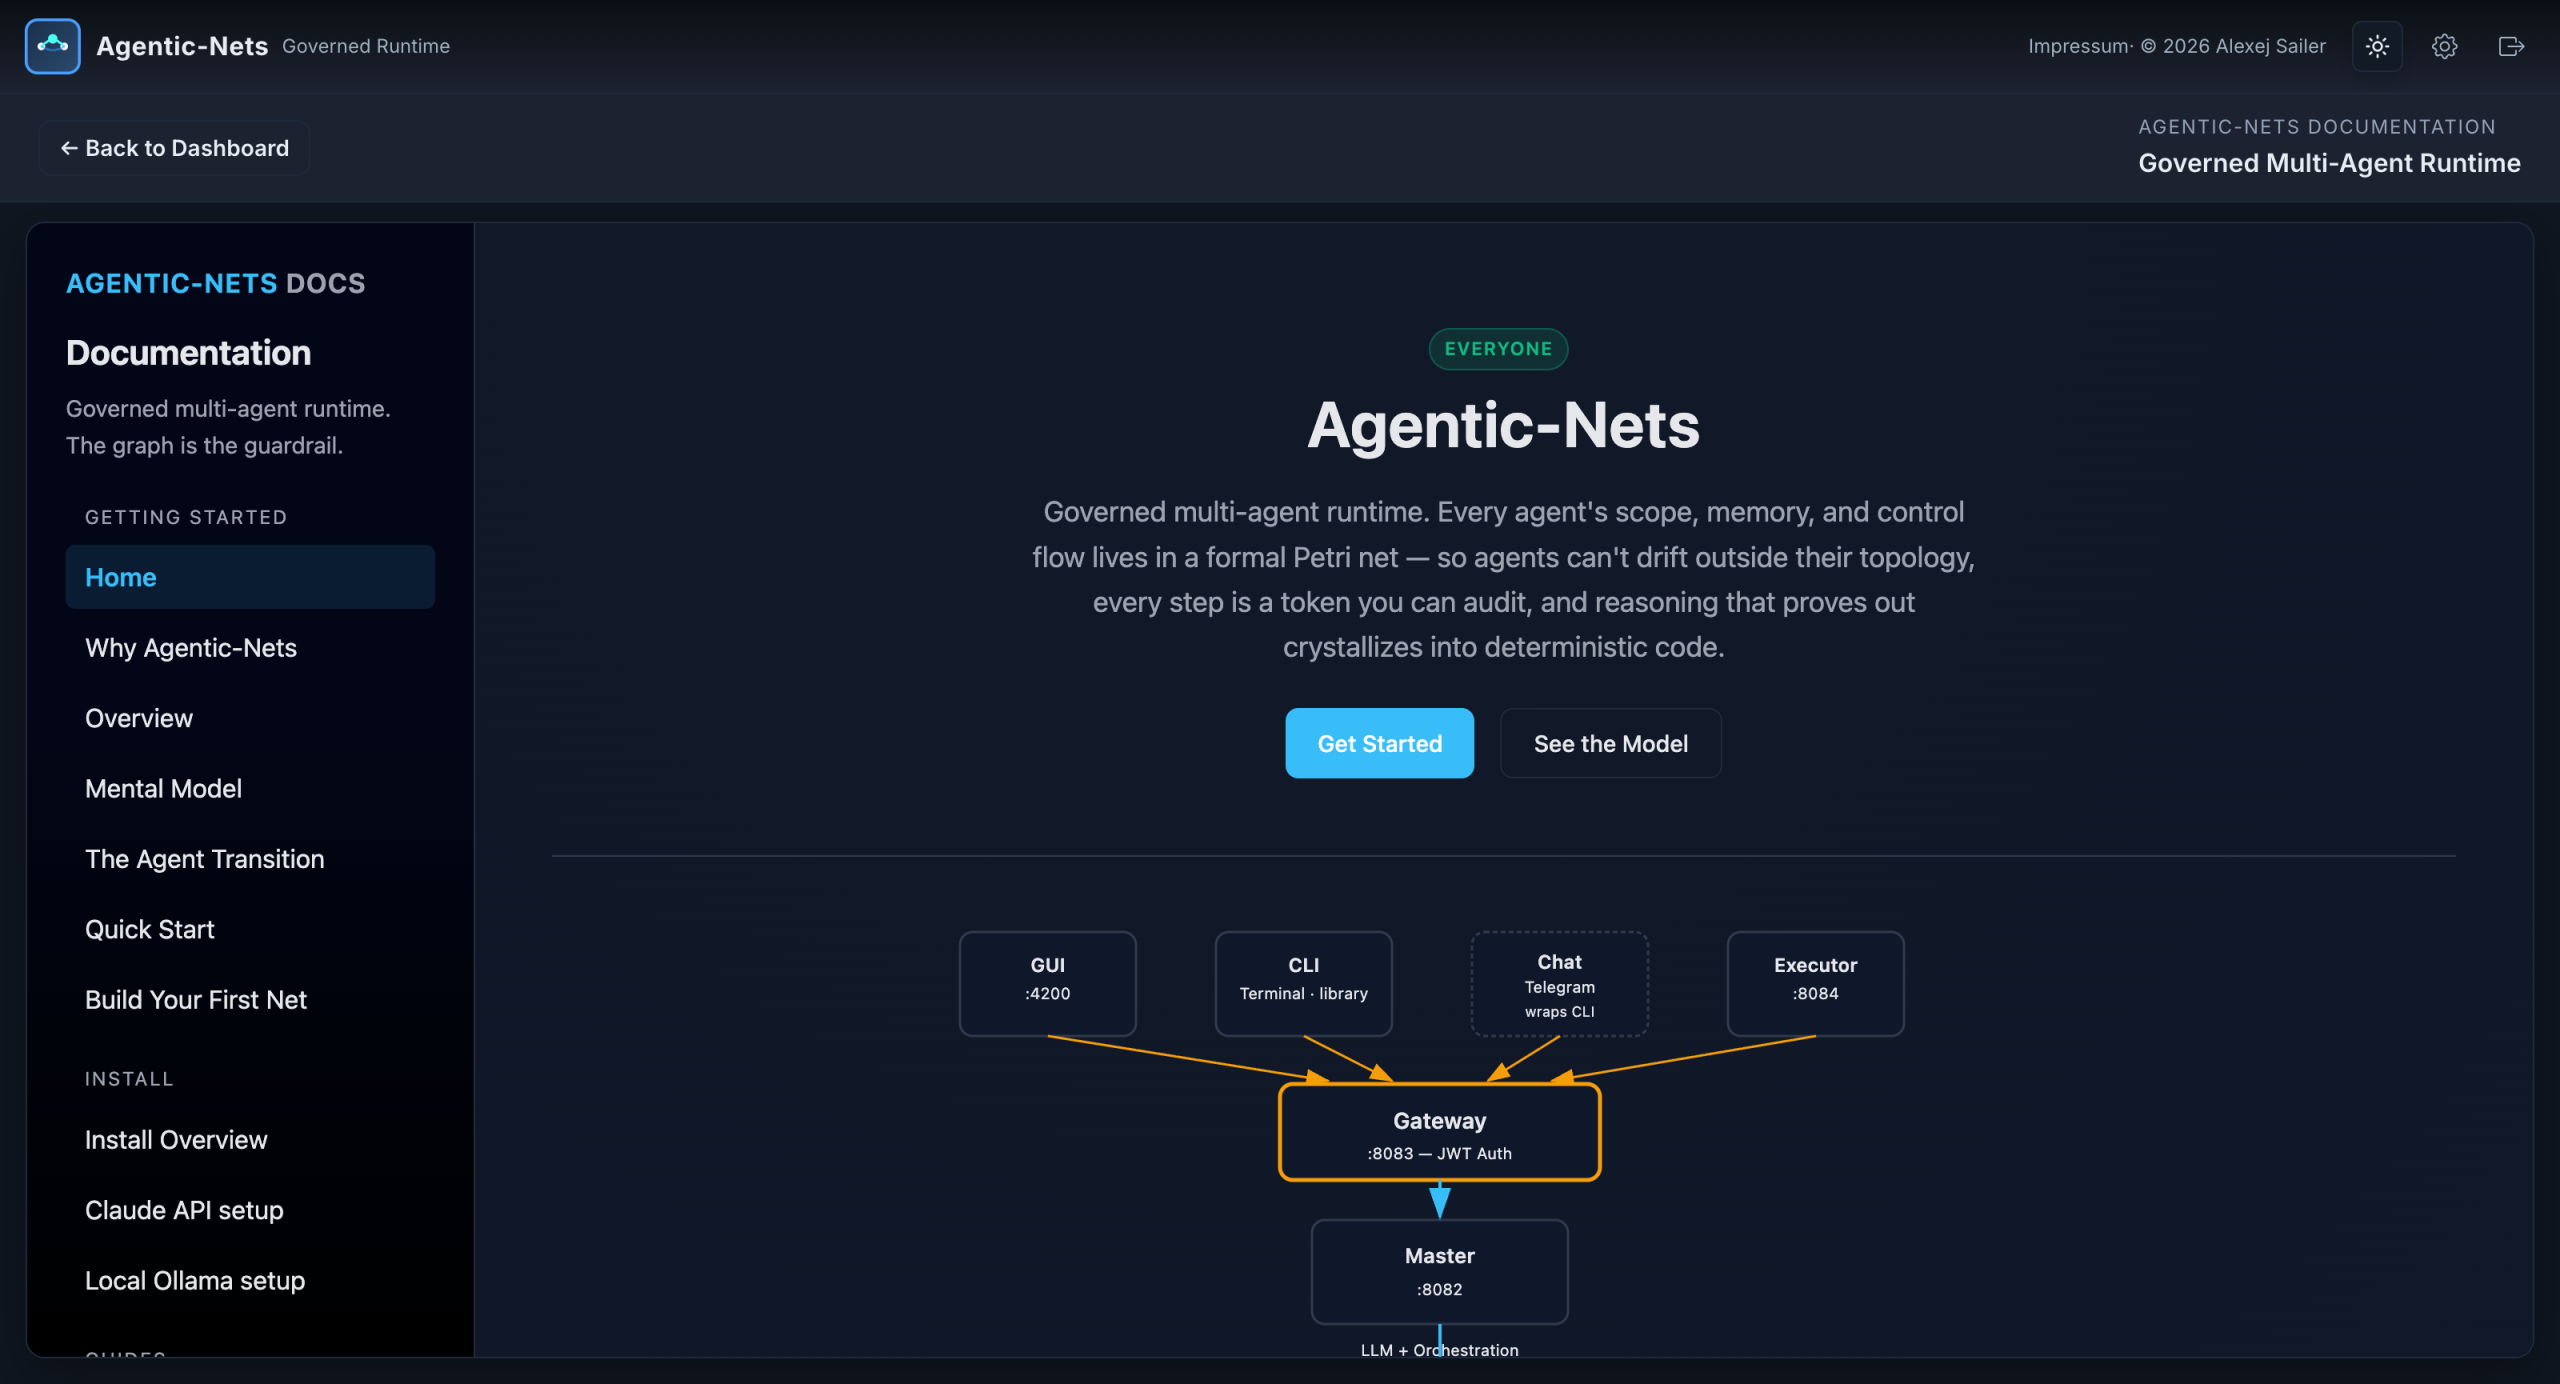
Before any login, the documentation hub is open to everyone. It covers the four things a new user needs in order: installing with Docker Compose and a single .env file, the core concepts (places, tokens, transitions, inscriptions), the runtime and its APIs (ArcQL queries, the pull-polling executor, token reservations), and production deployment with TLS and observability. If you only remember one path: clone the public repository, copy the environment template, run docker compose up, and open the Universal Assistant.
Step 3: Governed Access
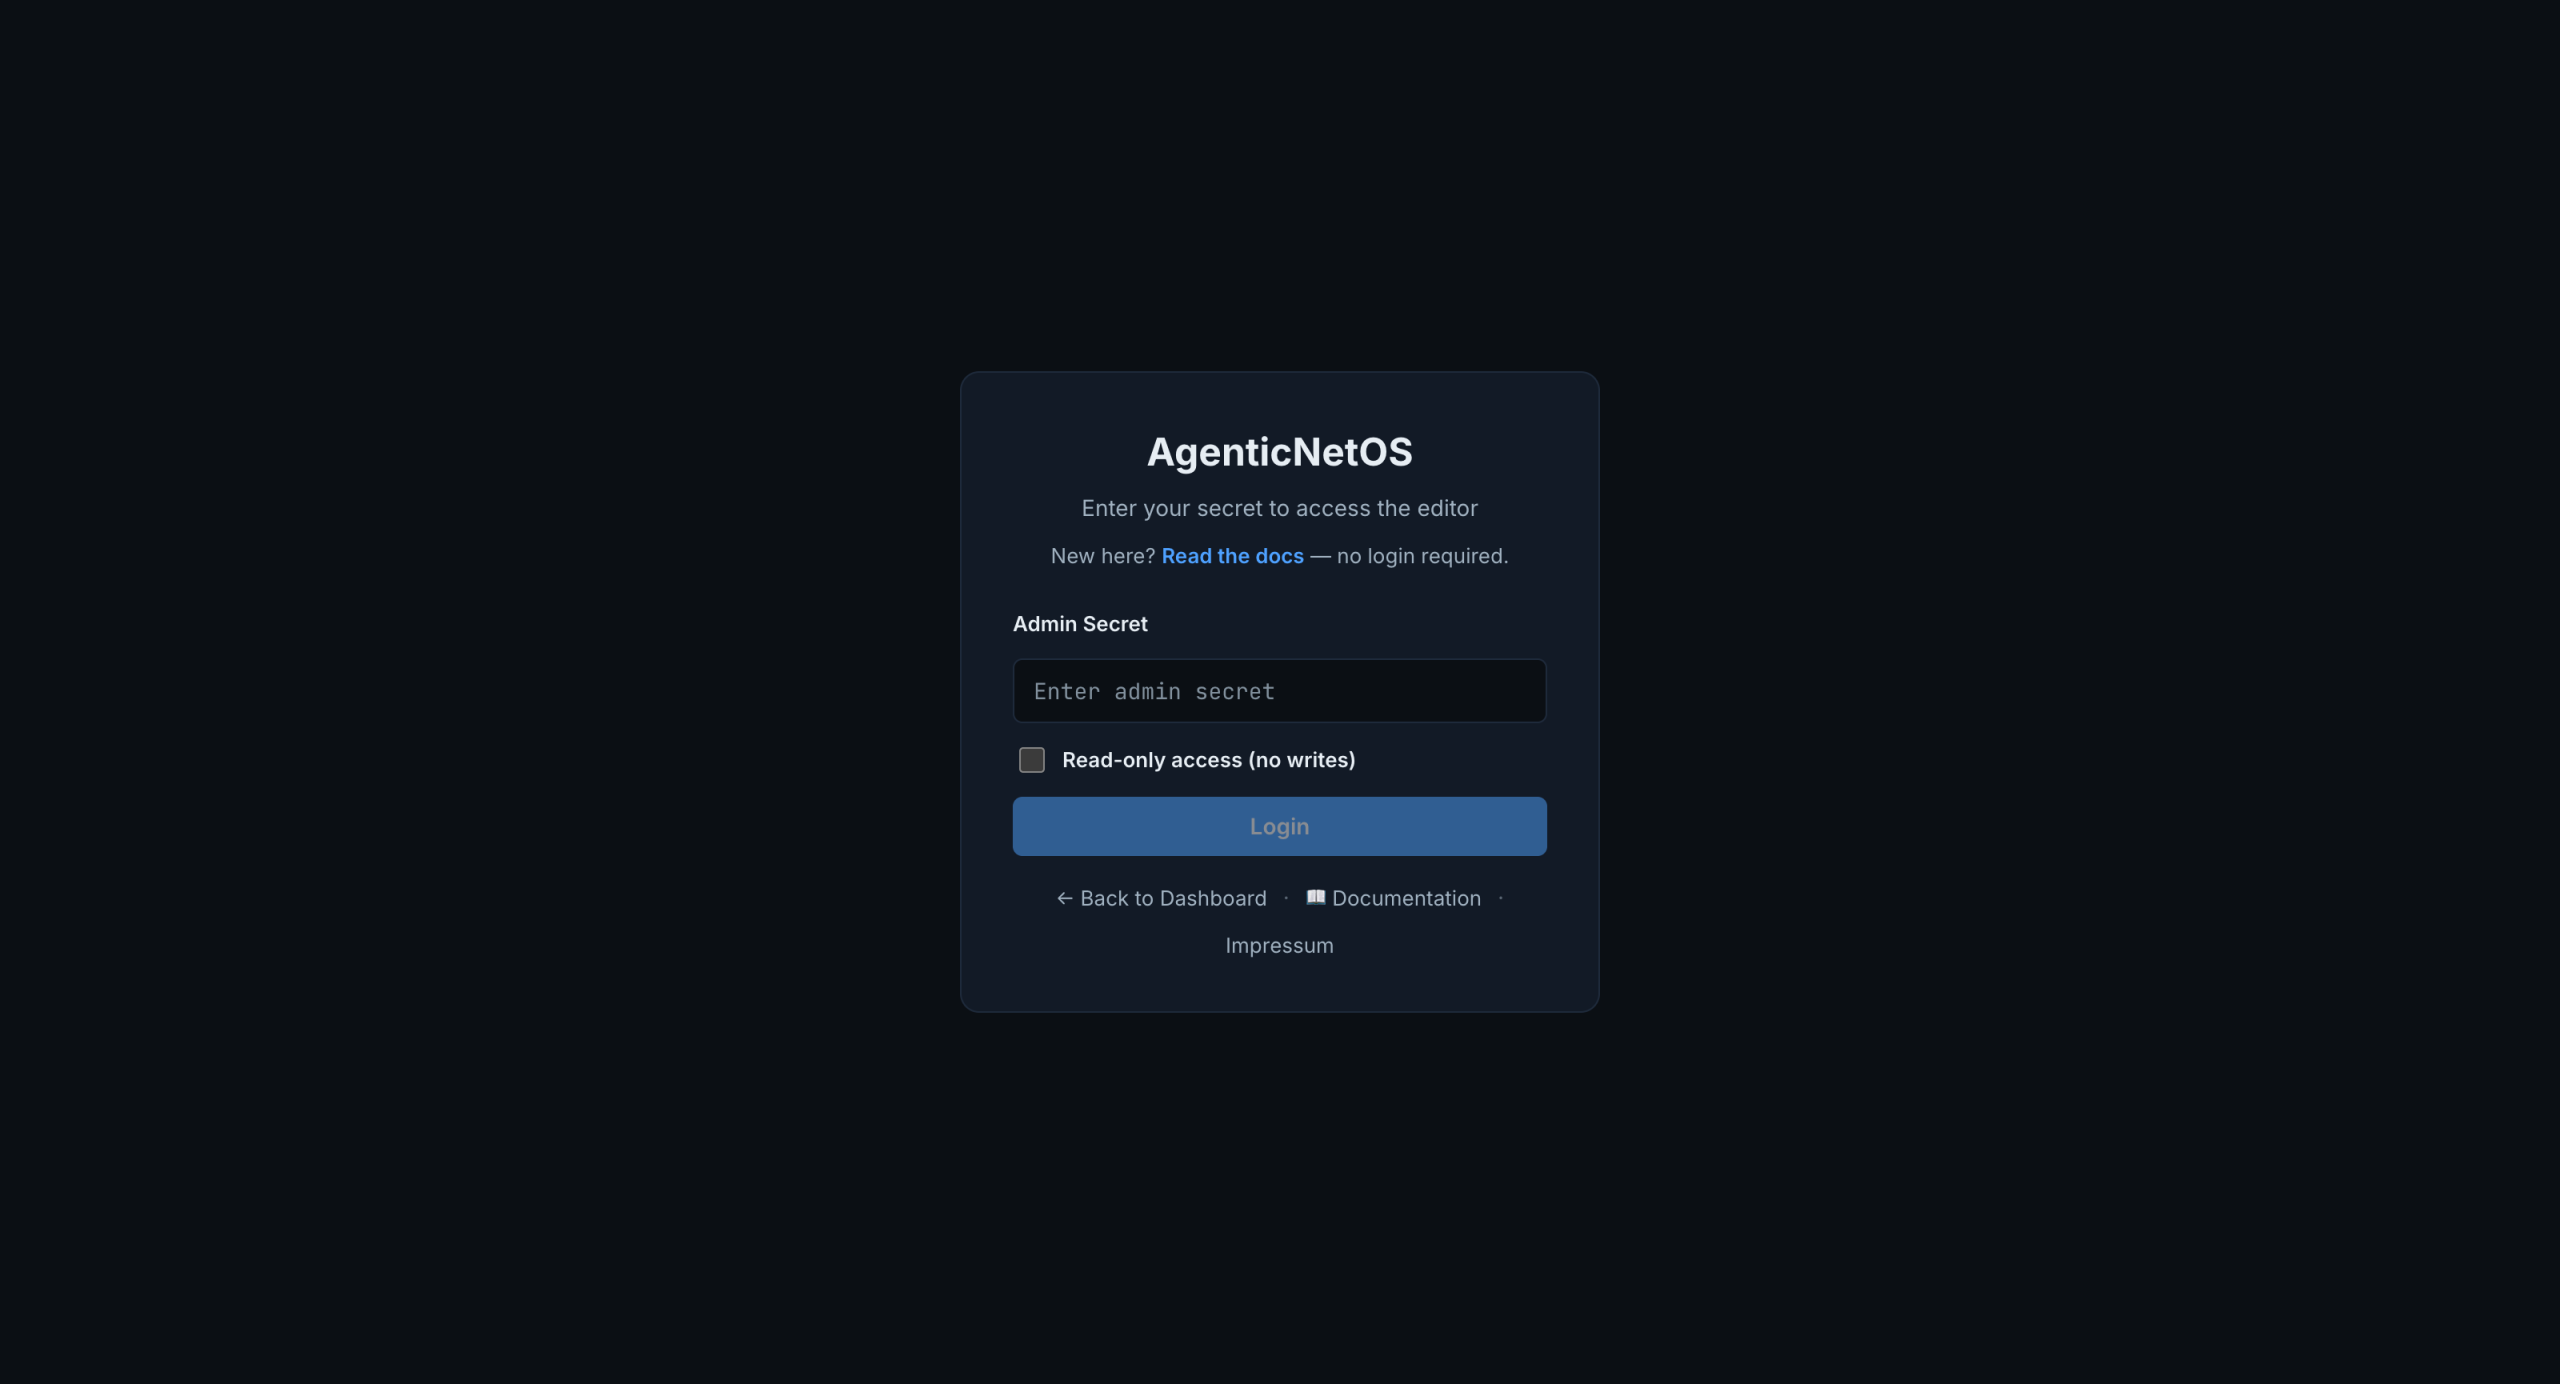
The editor is behind a login for a reason: this is an operations tool, not a sandbox. You authenticate with an admin secret that the OAuth2 gateway generates on first startup. Alternatively you check read-only access and use a separate read-only secret. The distinction is not cosmetic. Read-only sessions authenticate as a different client, and the gateway itself rejects every write they attempt. The interface hiding edit buttons is a courtesy; the enforcement lives at the API boundary.
Step 4: The Studio
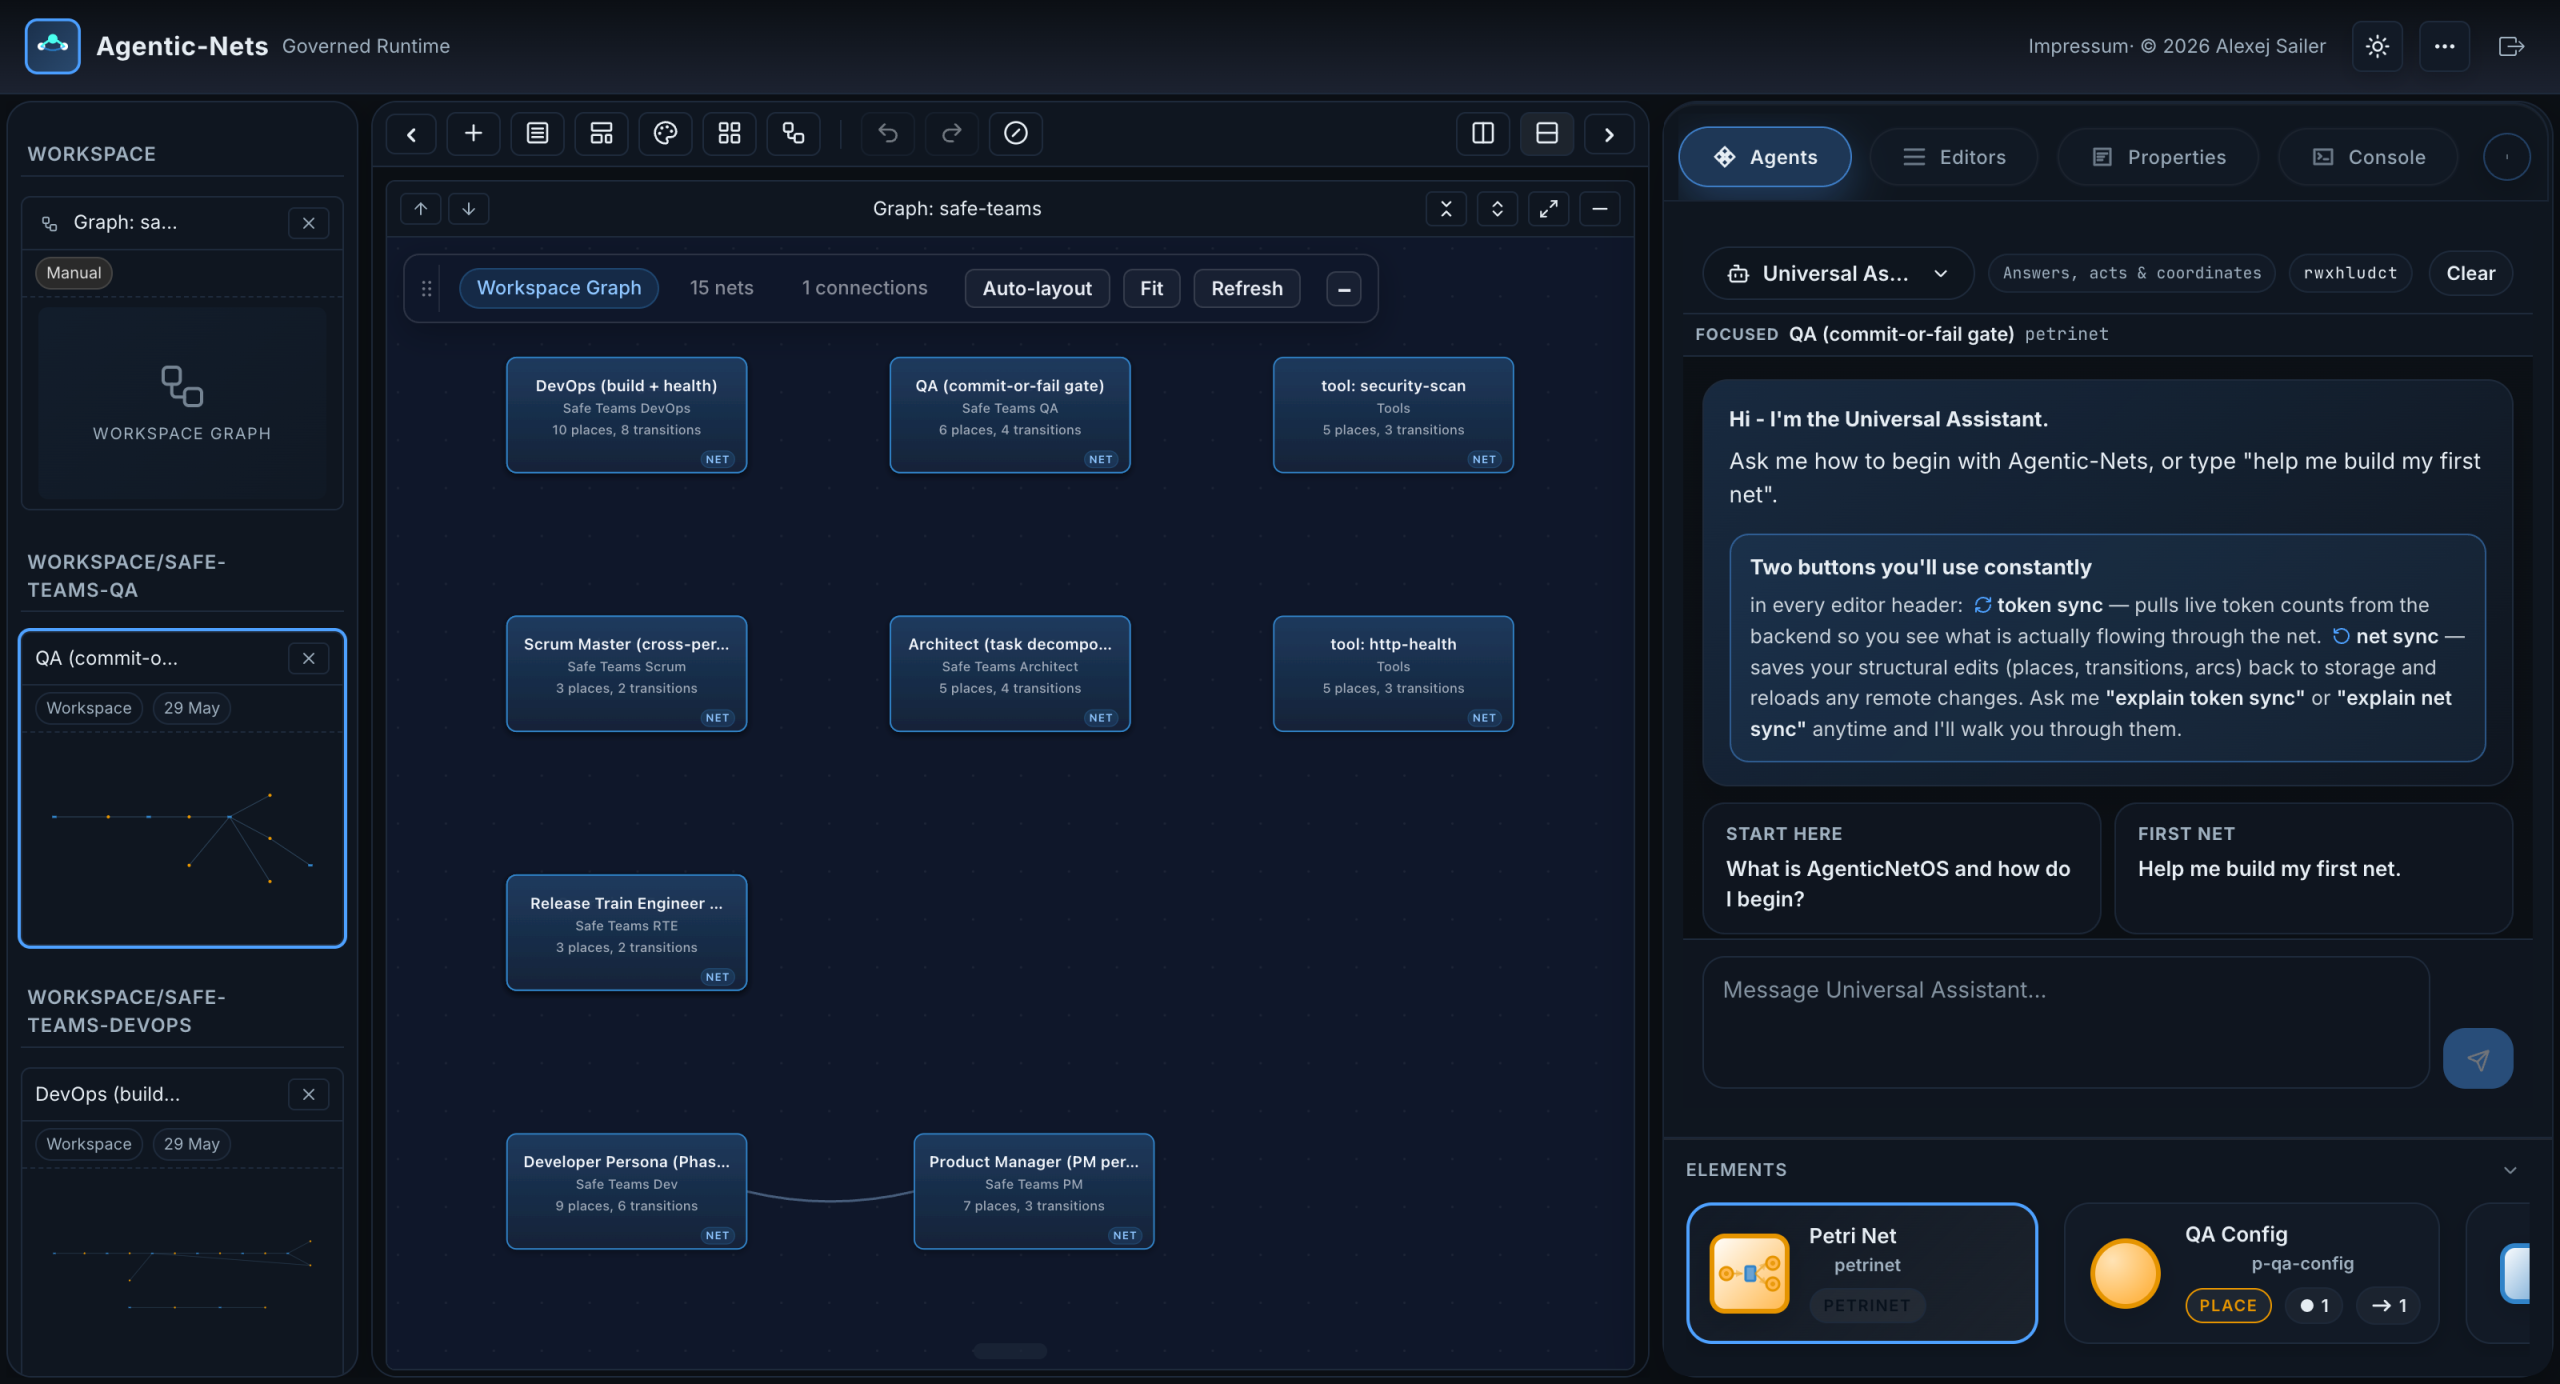
This is the Studio, and the layout has three zones. On the left, the workspace list shows every open net grouped by session, each with a live minimap preview. In the center, editor tiles show the actual Petri nets; you can stack them, resize them, and maximize any one of them. On the right, a tabbed sidebar hosts the Agents panel, Properties, Session management, Console, the tool Forge, a package browser, and more.
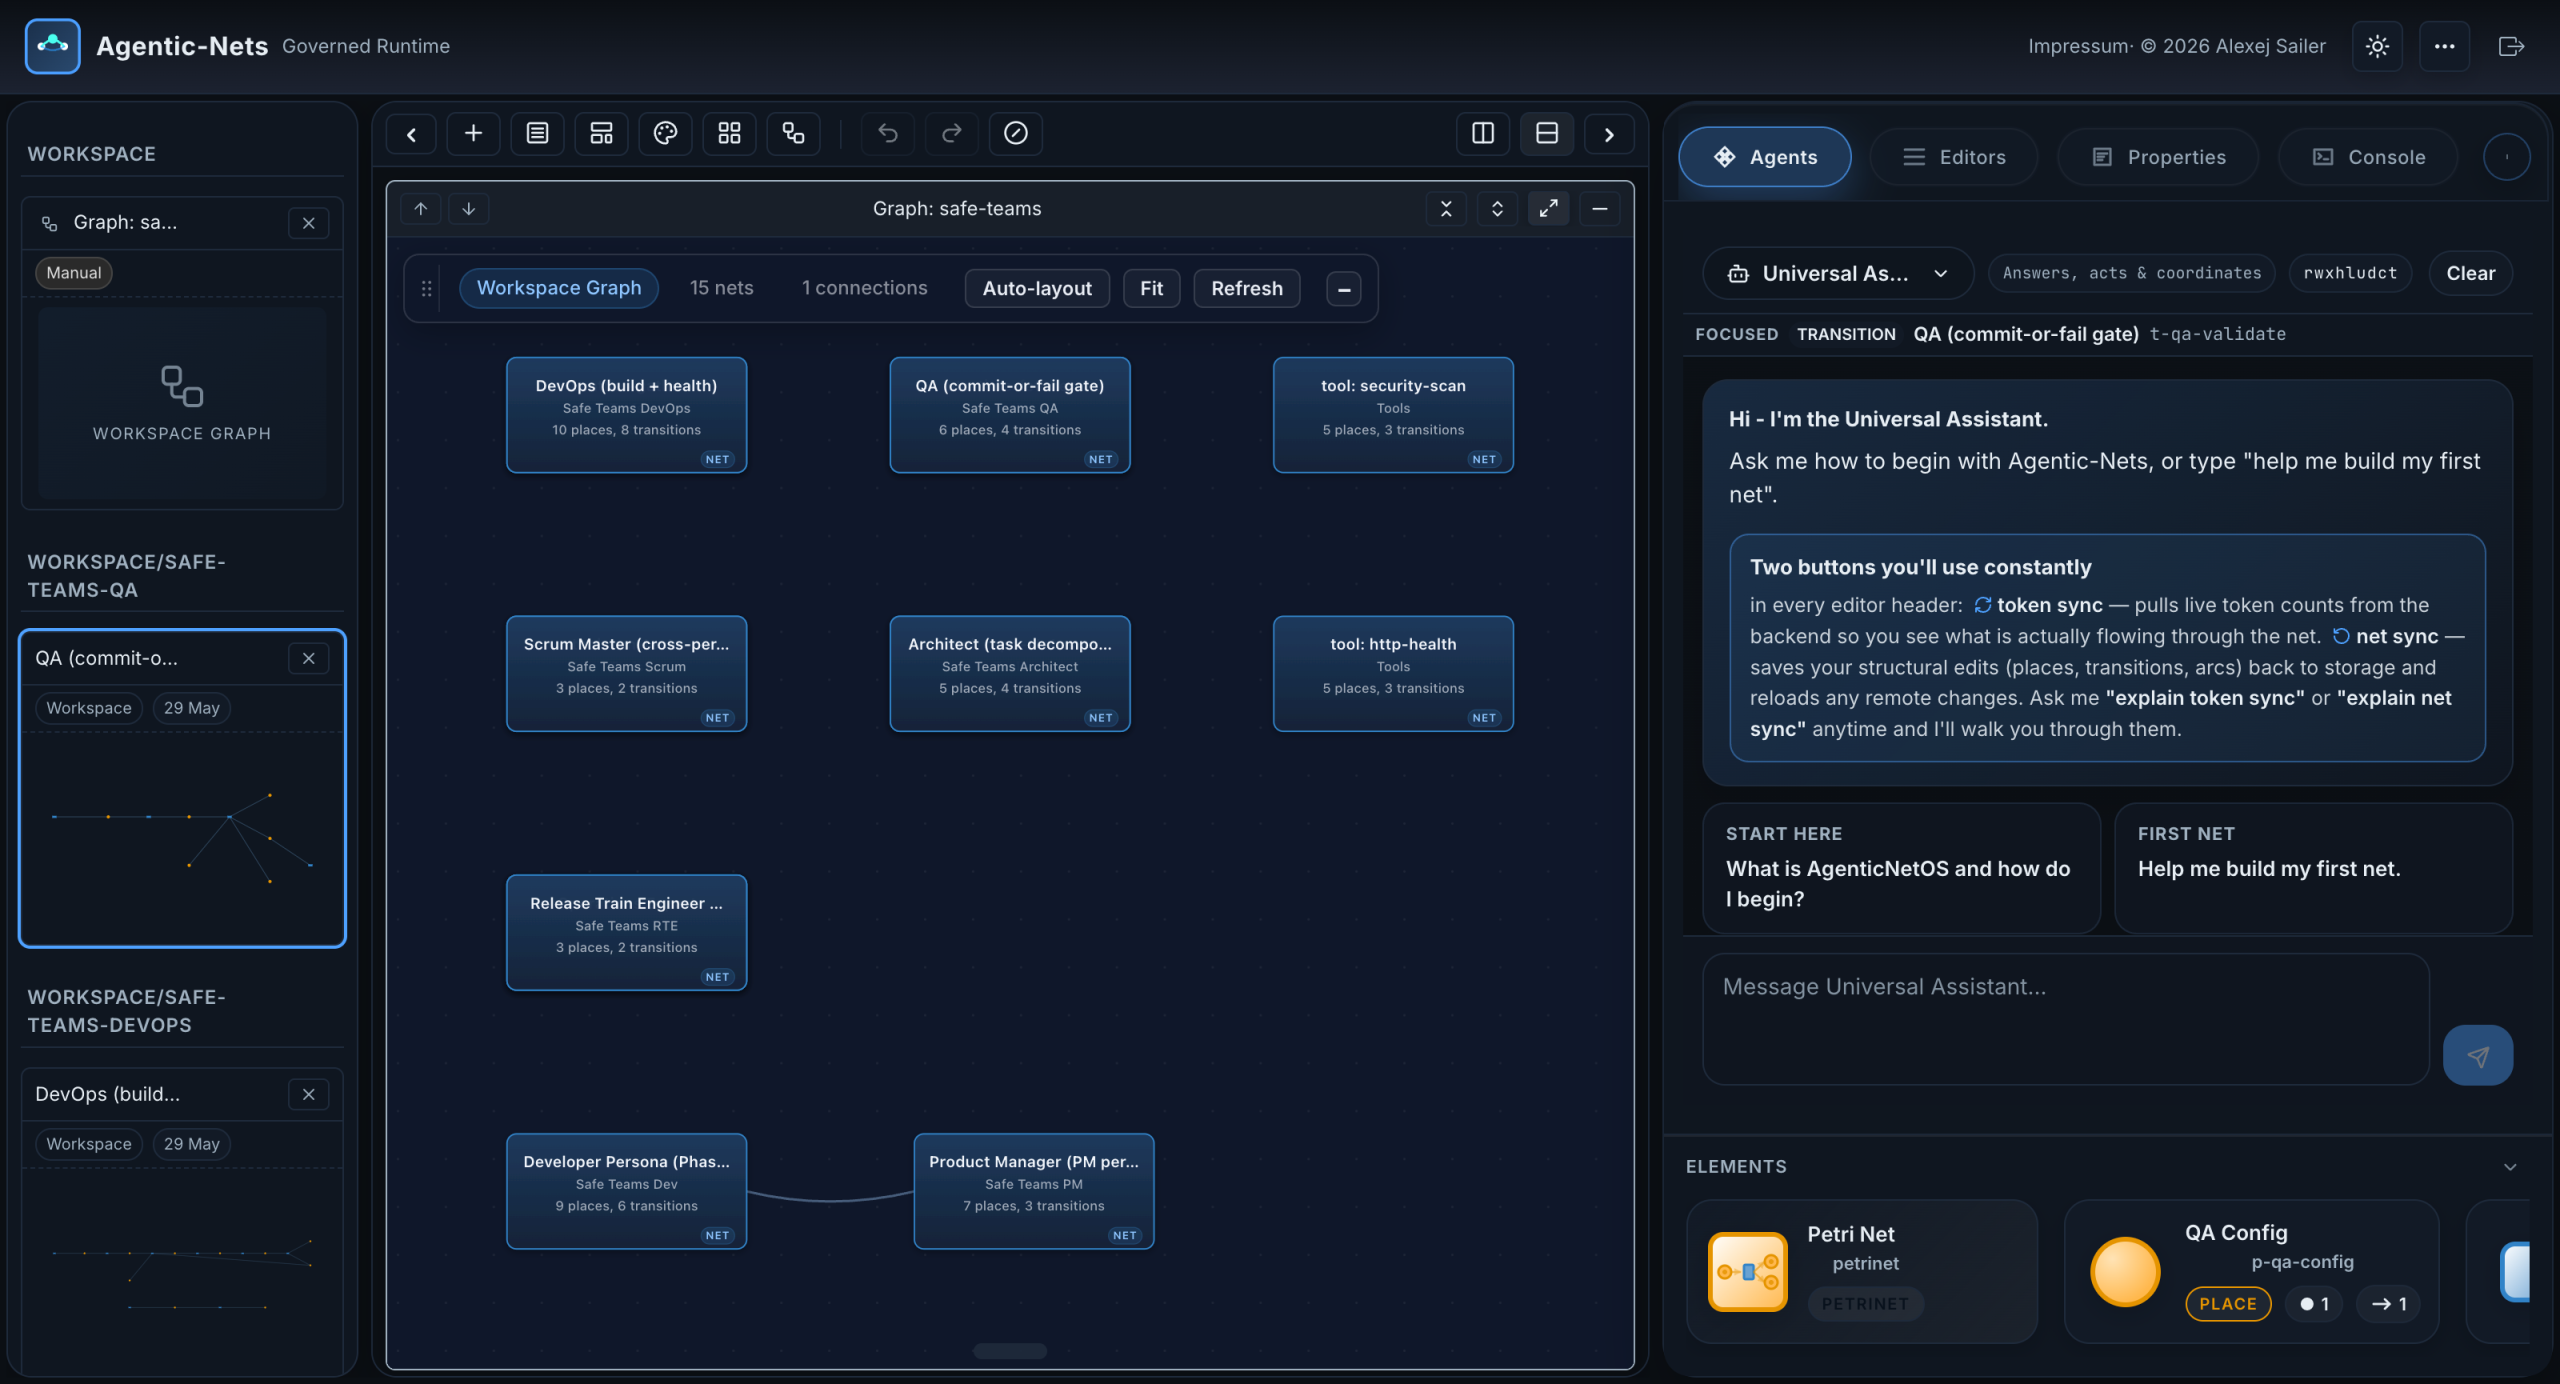
The workspace you see loaded is the safe teams model. Nine nets are open, one per team role, and the top tile shows the Workspace Graph, which is where we go next.
Step 5: The Workspace Graph, a Whole Team on One Screen
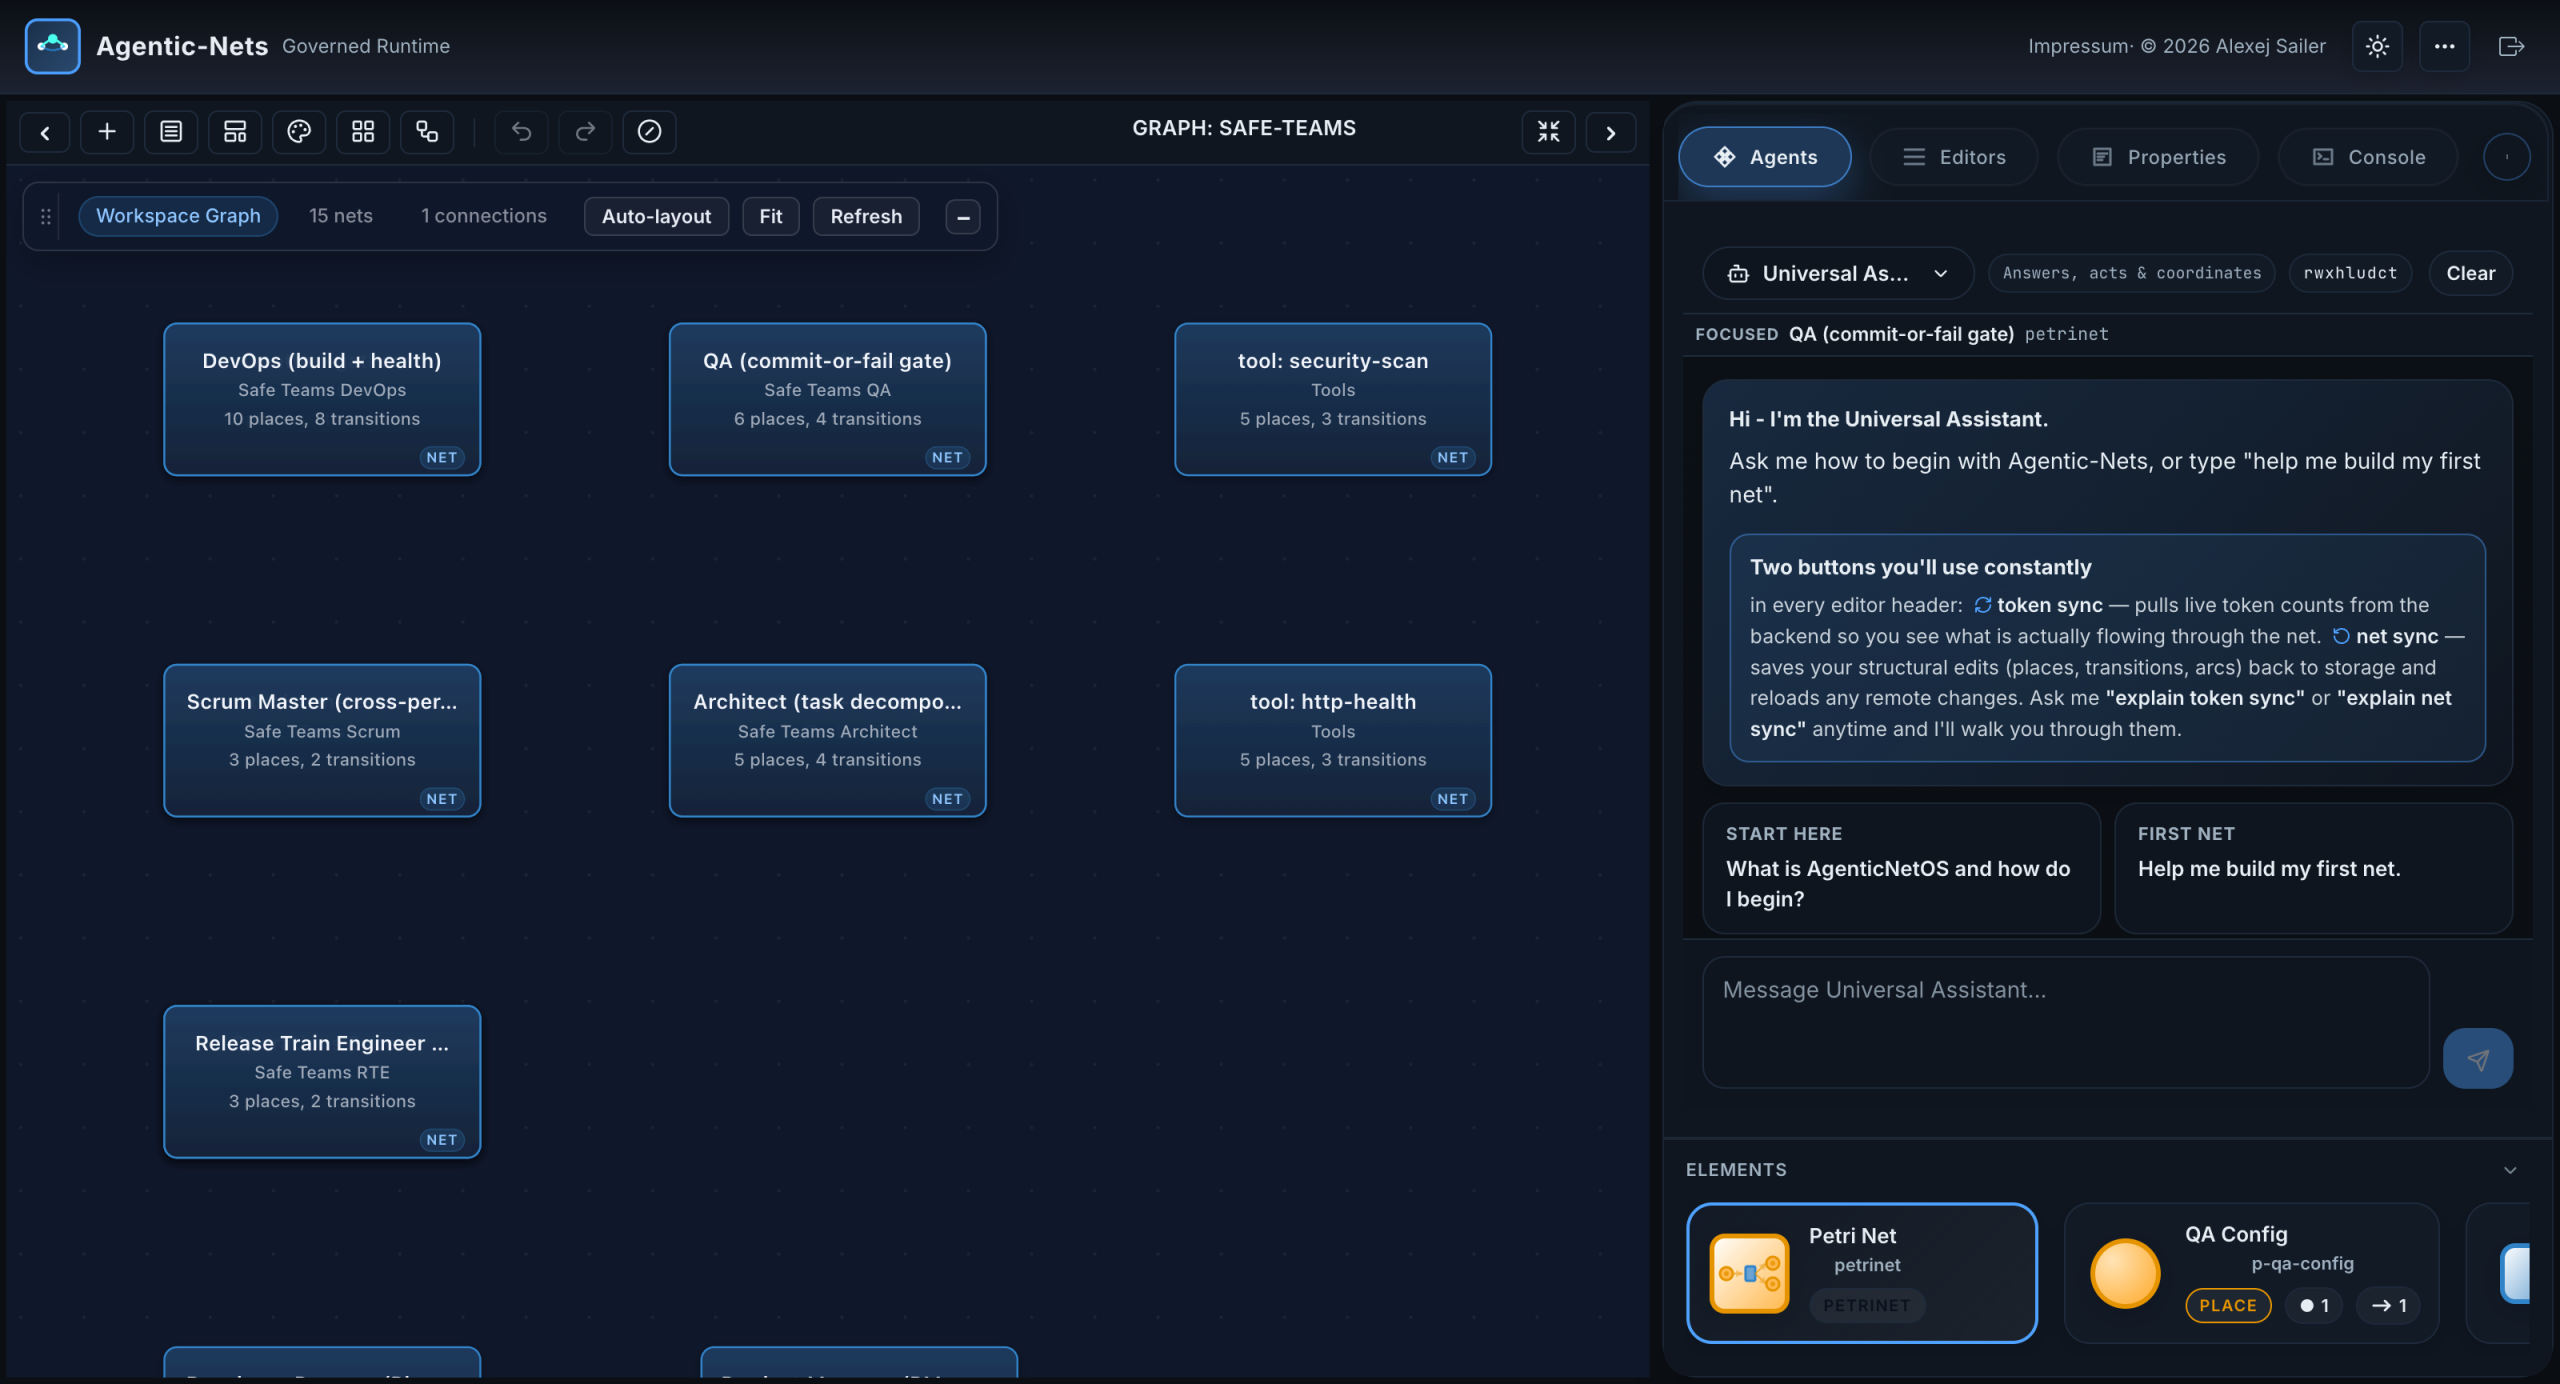
The Workspace Graph zooms out to the whole model. Every card is one net: its name, the session it lives in, and its size in places and transitions. The edges between cards are shared places, which is the real coupling between nets. When the Developer net finishes a piece of work, it emits a token into a place the QA net reads from; that handoff is an edge on this graph. This single screen answers the question every multi-agent system eventually faces: who talks to whom, and through what?
Alongside the team roles you can see utility nets in the Tools session: an http health checker, a security scanner, a test runner, a repo status reporter. These are tool-nets, reusable capabilities packaged as nets, invokable by agents. Double-click any card and it opens as an editor tile.
Step 6: One Net Up Close, the QA Commit-or-Fail Gate
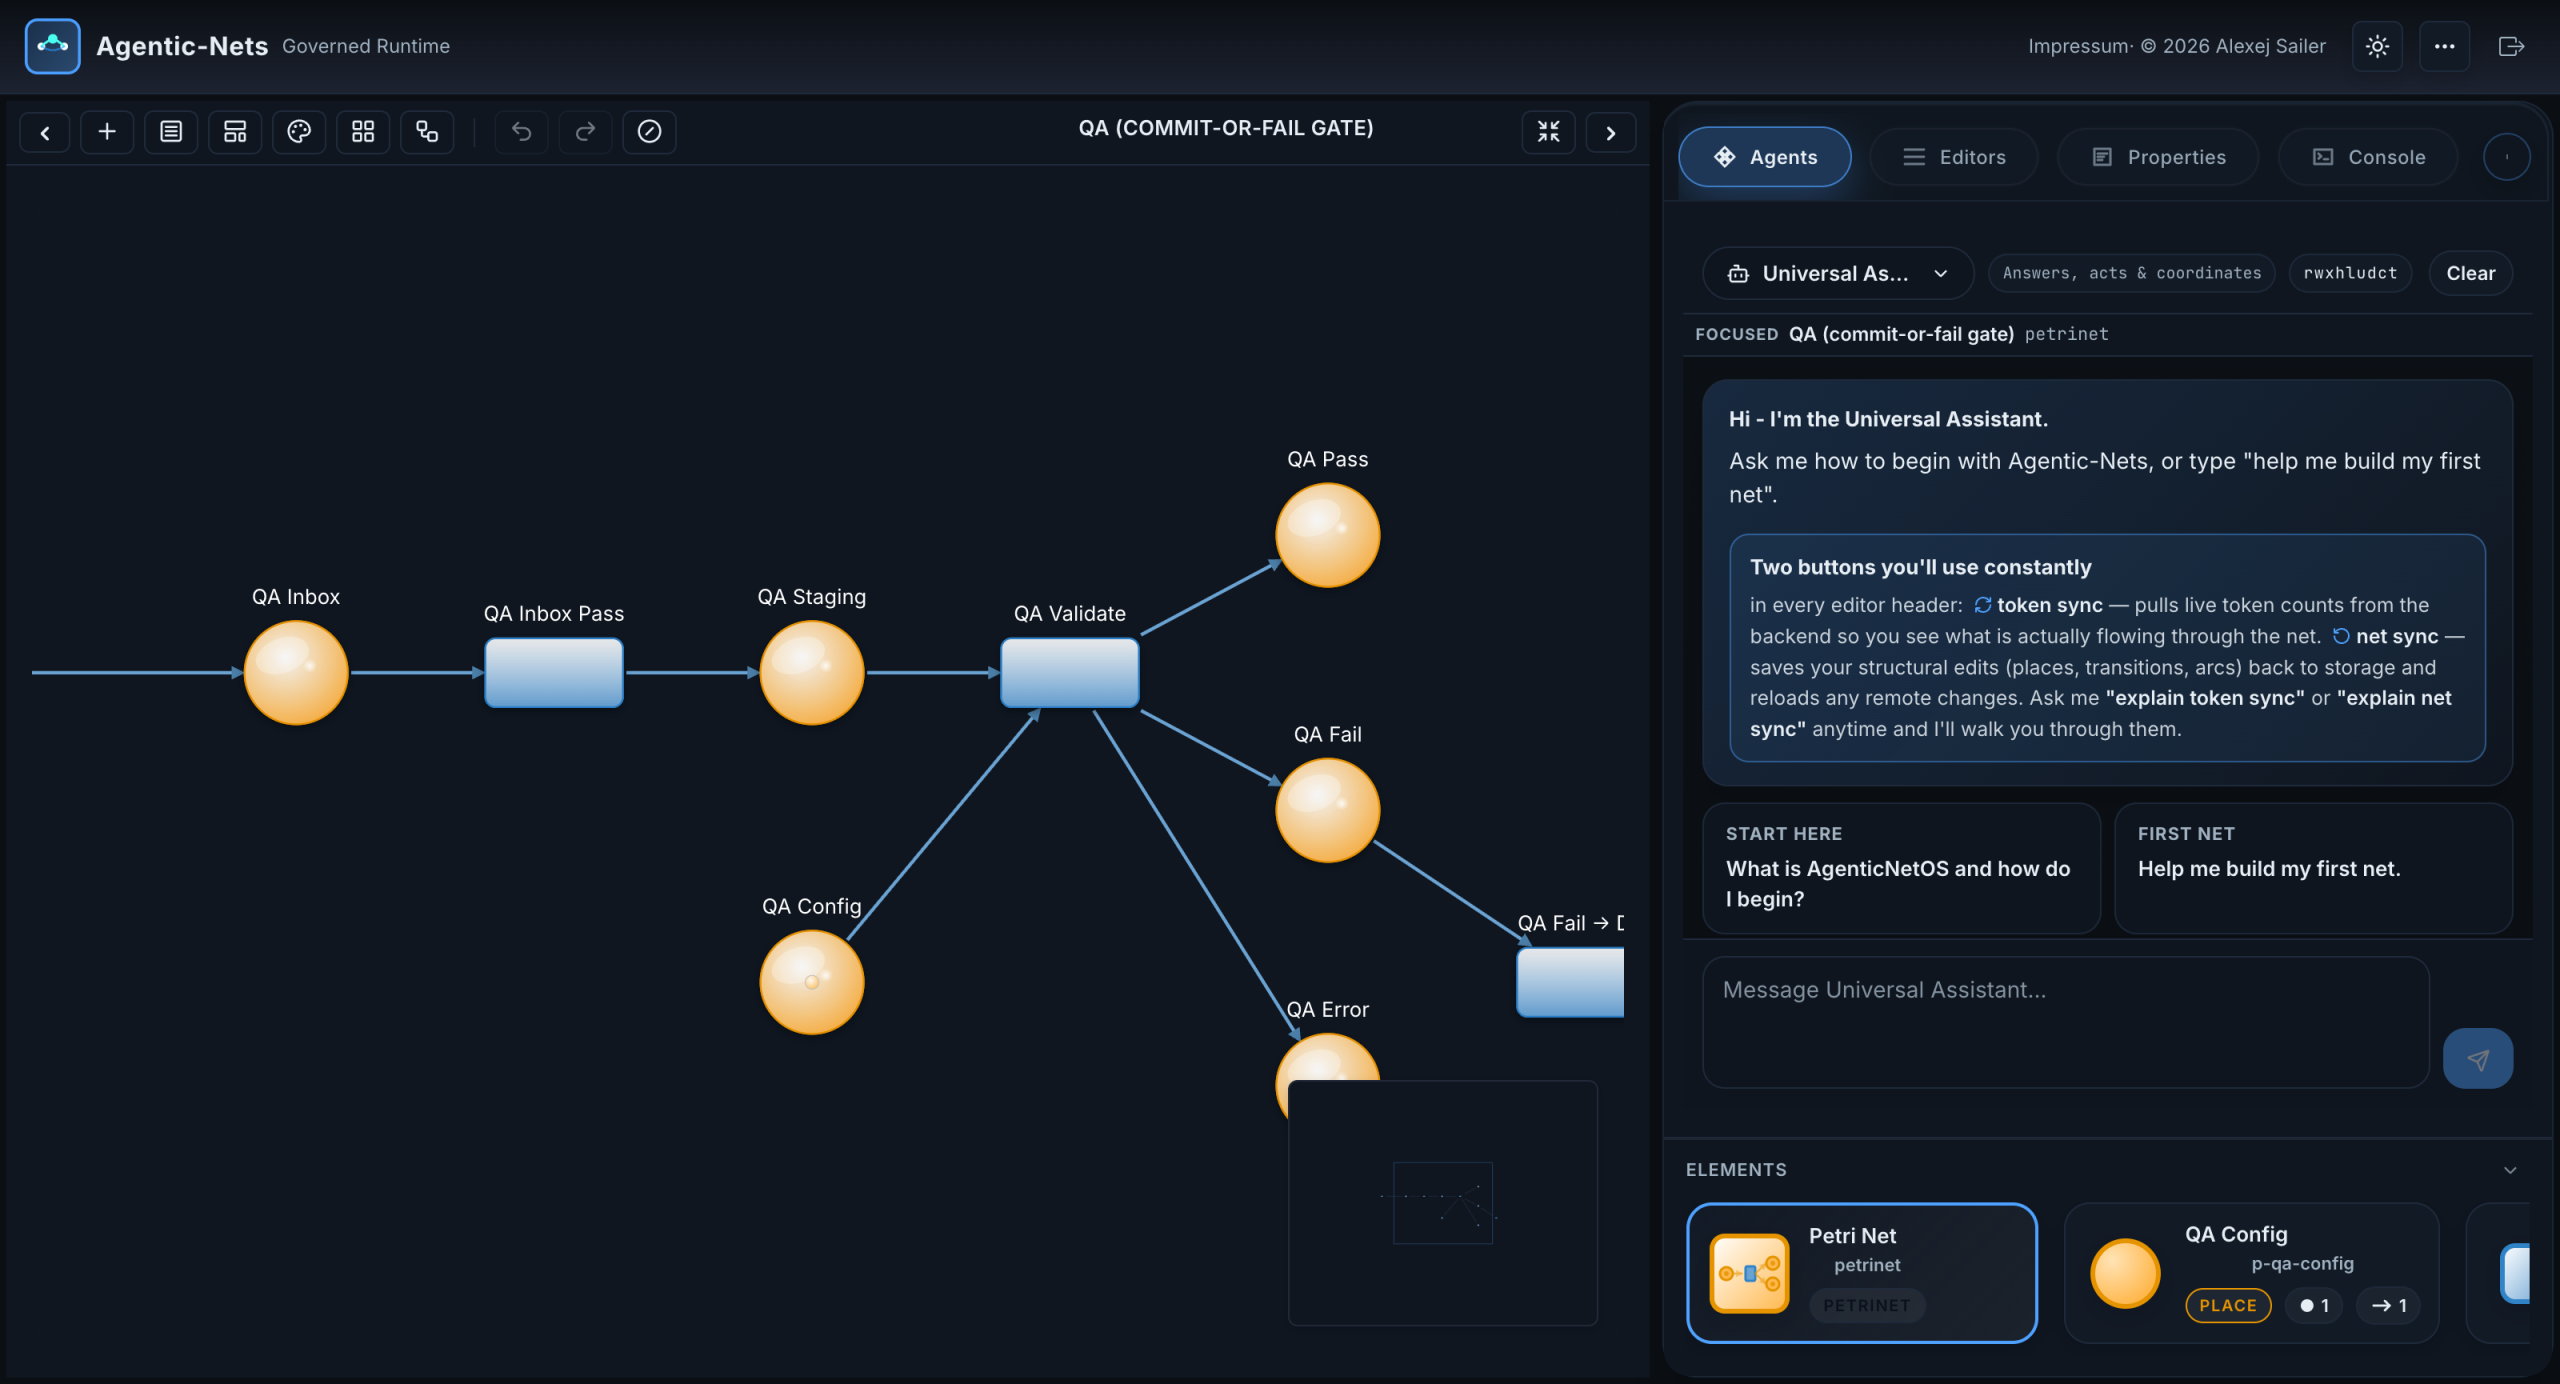
Here is one net maximized: QA, the commit-or-fail gate. The orange circles are places, persistent containers where tokens live. The blue rectangles are transitions, the units of work. Work arrives from the Developer net in QA Inbox, moves through staging into QA Validate, and then routes three ways: QA Pass hands off to DevOps, QA Fail sends rework back to the Developer net, and QA Error captures anything unexpected so nothing is ever silently lost.
This is the safety property that makes Petri nets worth the ceremony: the topology is the process. There is no hidden code path that can skip the gate. If a token reaches DevOps, it provably passed through QA Validate, and the event log can show you exactly when and with what data.
Step 7: Tile Controls, Sync, Commentary, and Exports
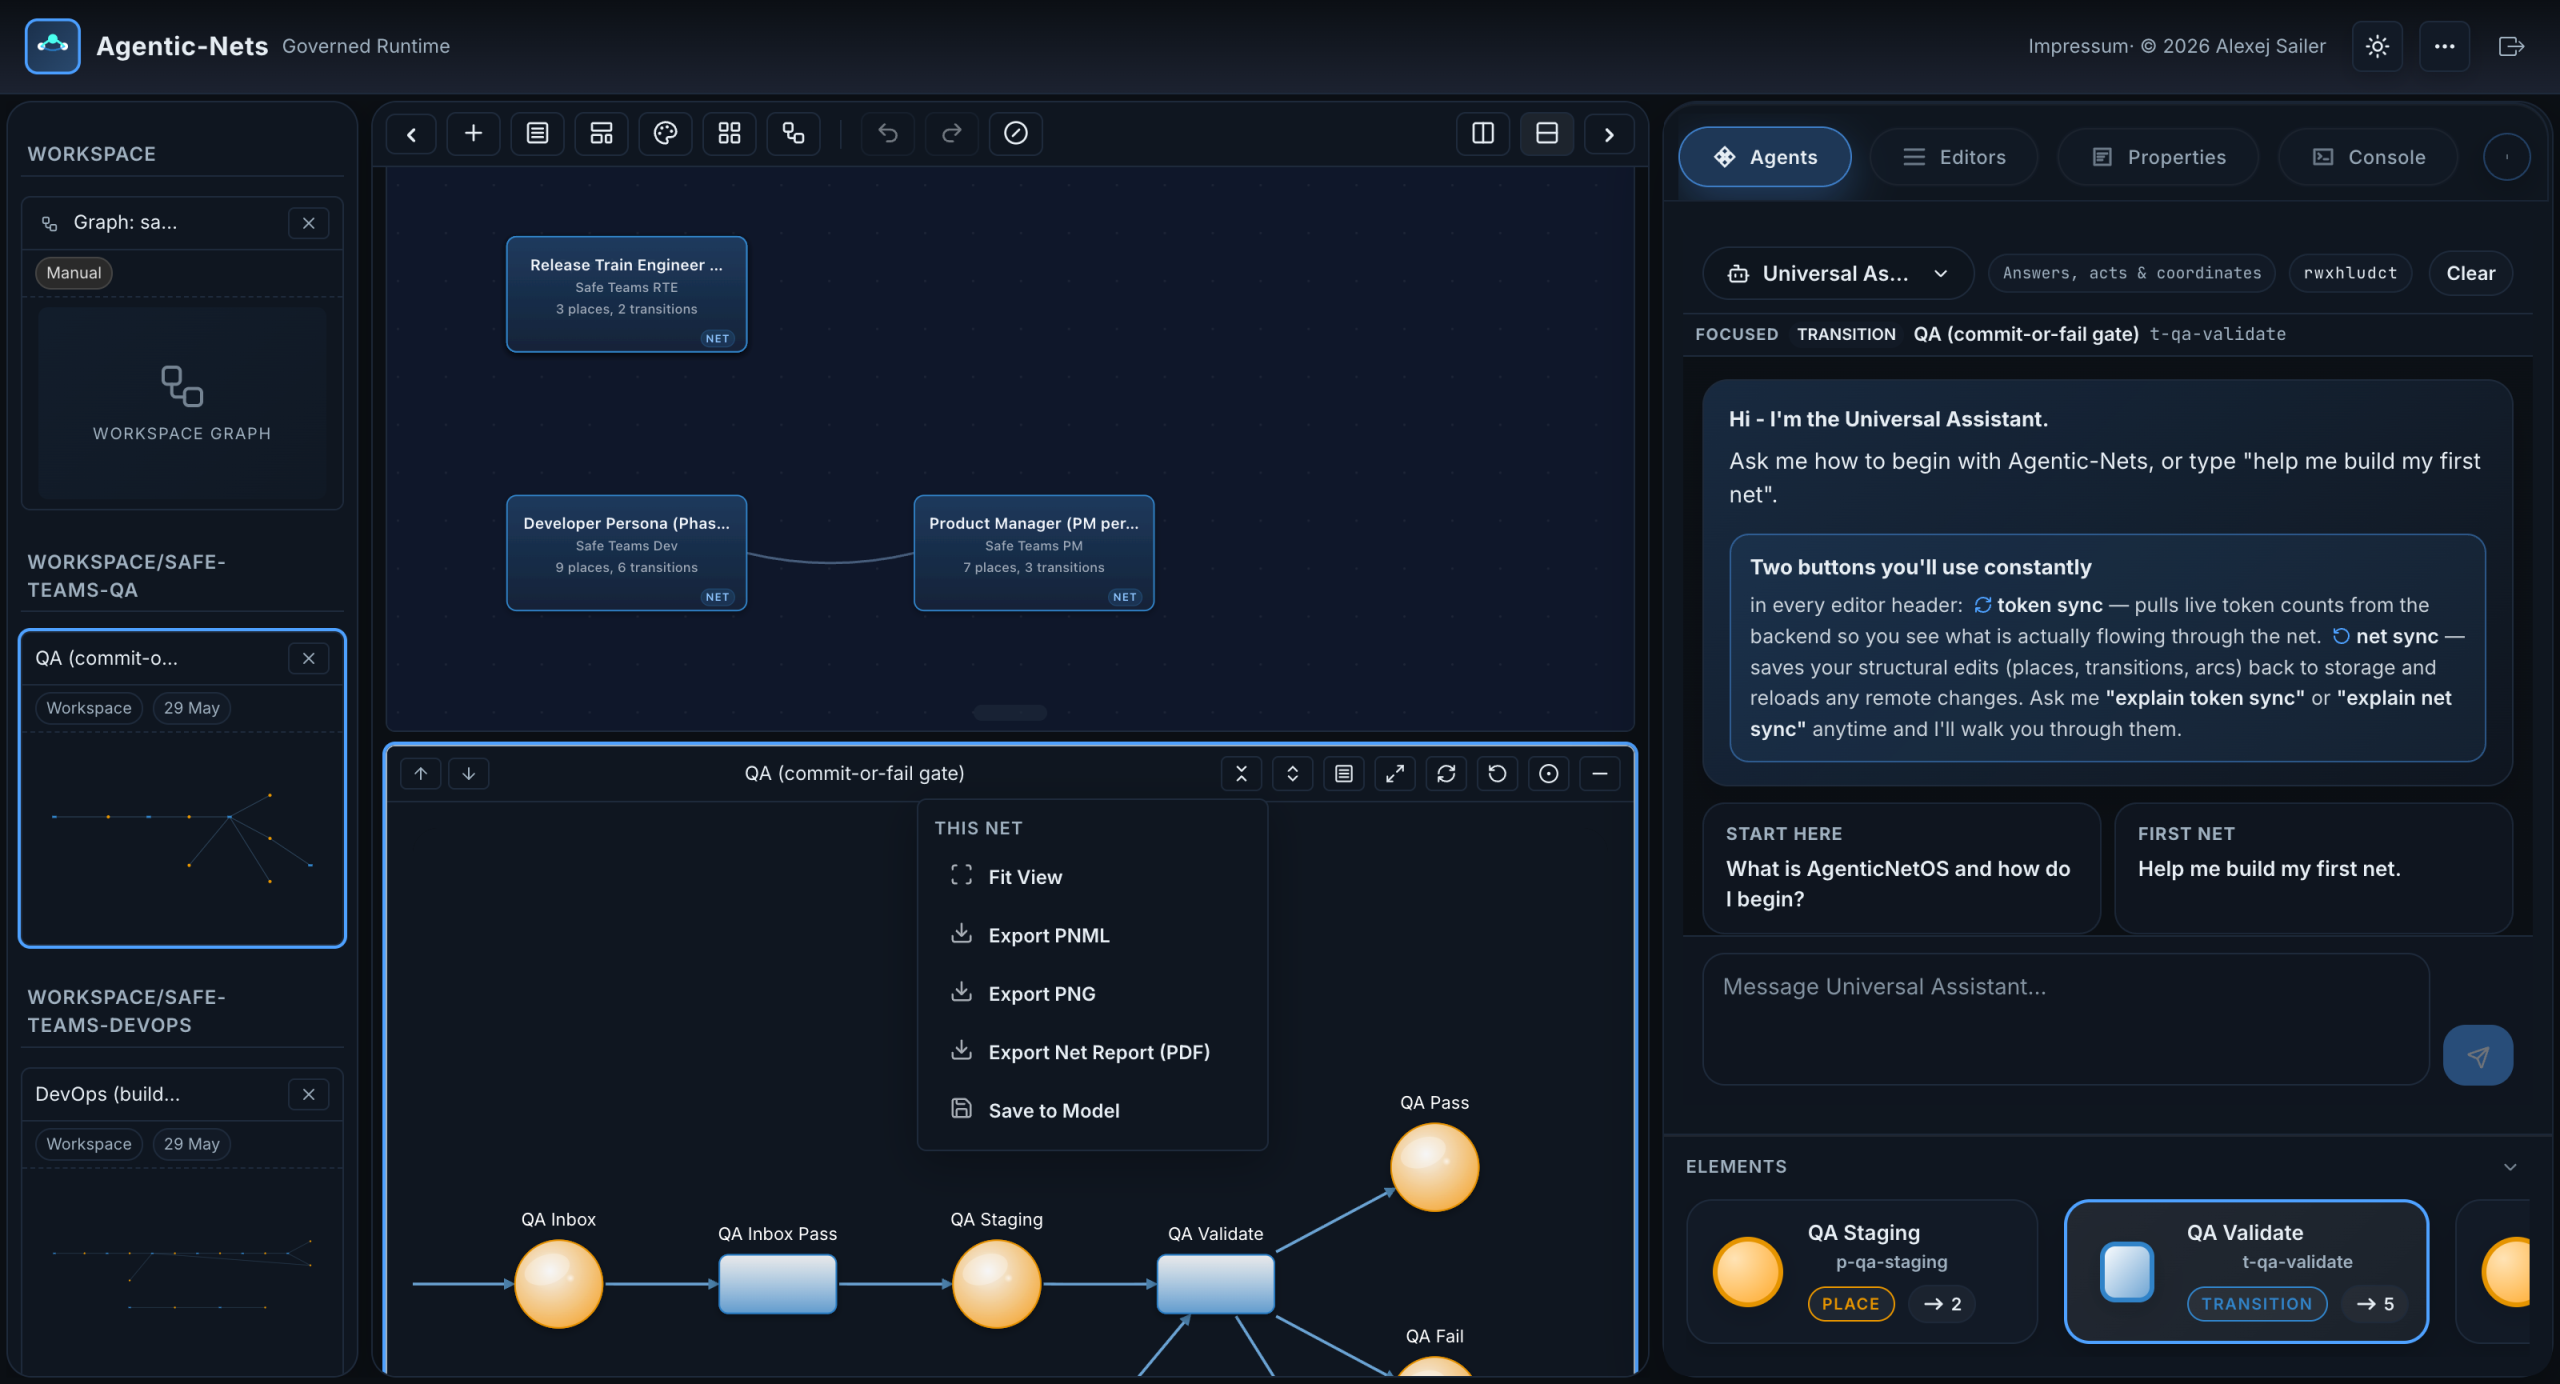
Every editor tile carries the same compact header controls, and two of them you will use constantly. Token sync pulls live token counts from the backend every few seconds so the canvas shows what is actually flowing. Net sync saves your structural edits back to storage and pulls in remote changes, keeping the canvas and the server from drifting apart.
Next to them: live commentary, which narrates net events in plain language as they happen, and the net actions menu shown open in the screenshot. From there you fit the view, export the net as PNML or PNG, export a full PDF report, or save the net back to the model. Nets are portable artifacts: export one here, import it into another deployment, and the inscriptions travel with it.
Step 8: The Universal Assistant and the Element Explorer
The Agents tab is where you talk to the platform. The Universal Assistant answers questions, builds nets on request, fires transitions, and coordinates the other personas. The welcome card teaches the two sync buttons; the suggested prompts below it are real starting points: ask what AgenticNetOS is, ask it to build your first net, or ask which persona should handle your current task.
At the bottom, the element explorer lists every place and transition of the focused net as cards with live token counts. It is the fastest way to jump from “which place is filling up?” to the exact element, and clicking a card selects it for the Properties panel we will see in a moment.
Step 9: Personas and the Permission Model
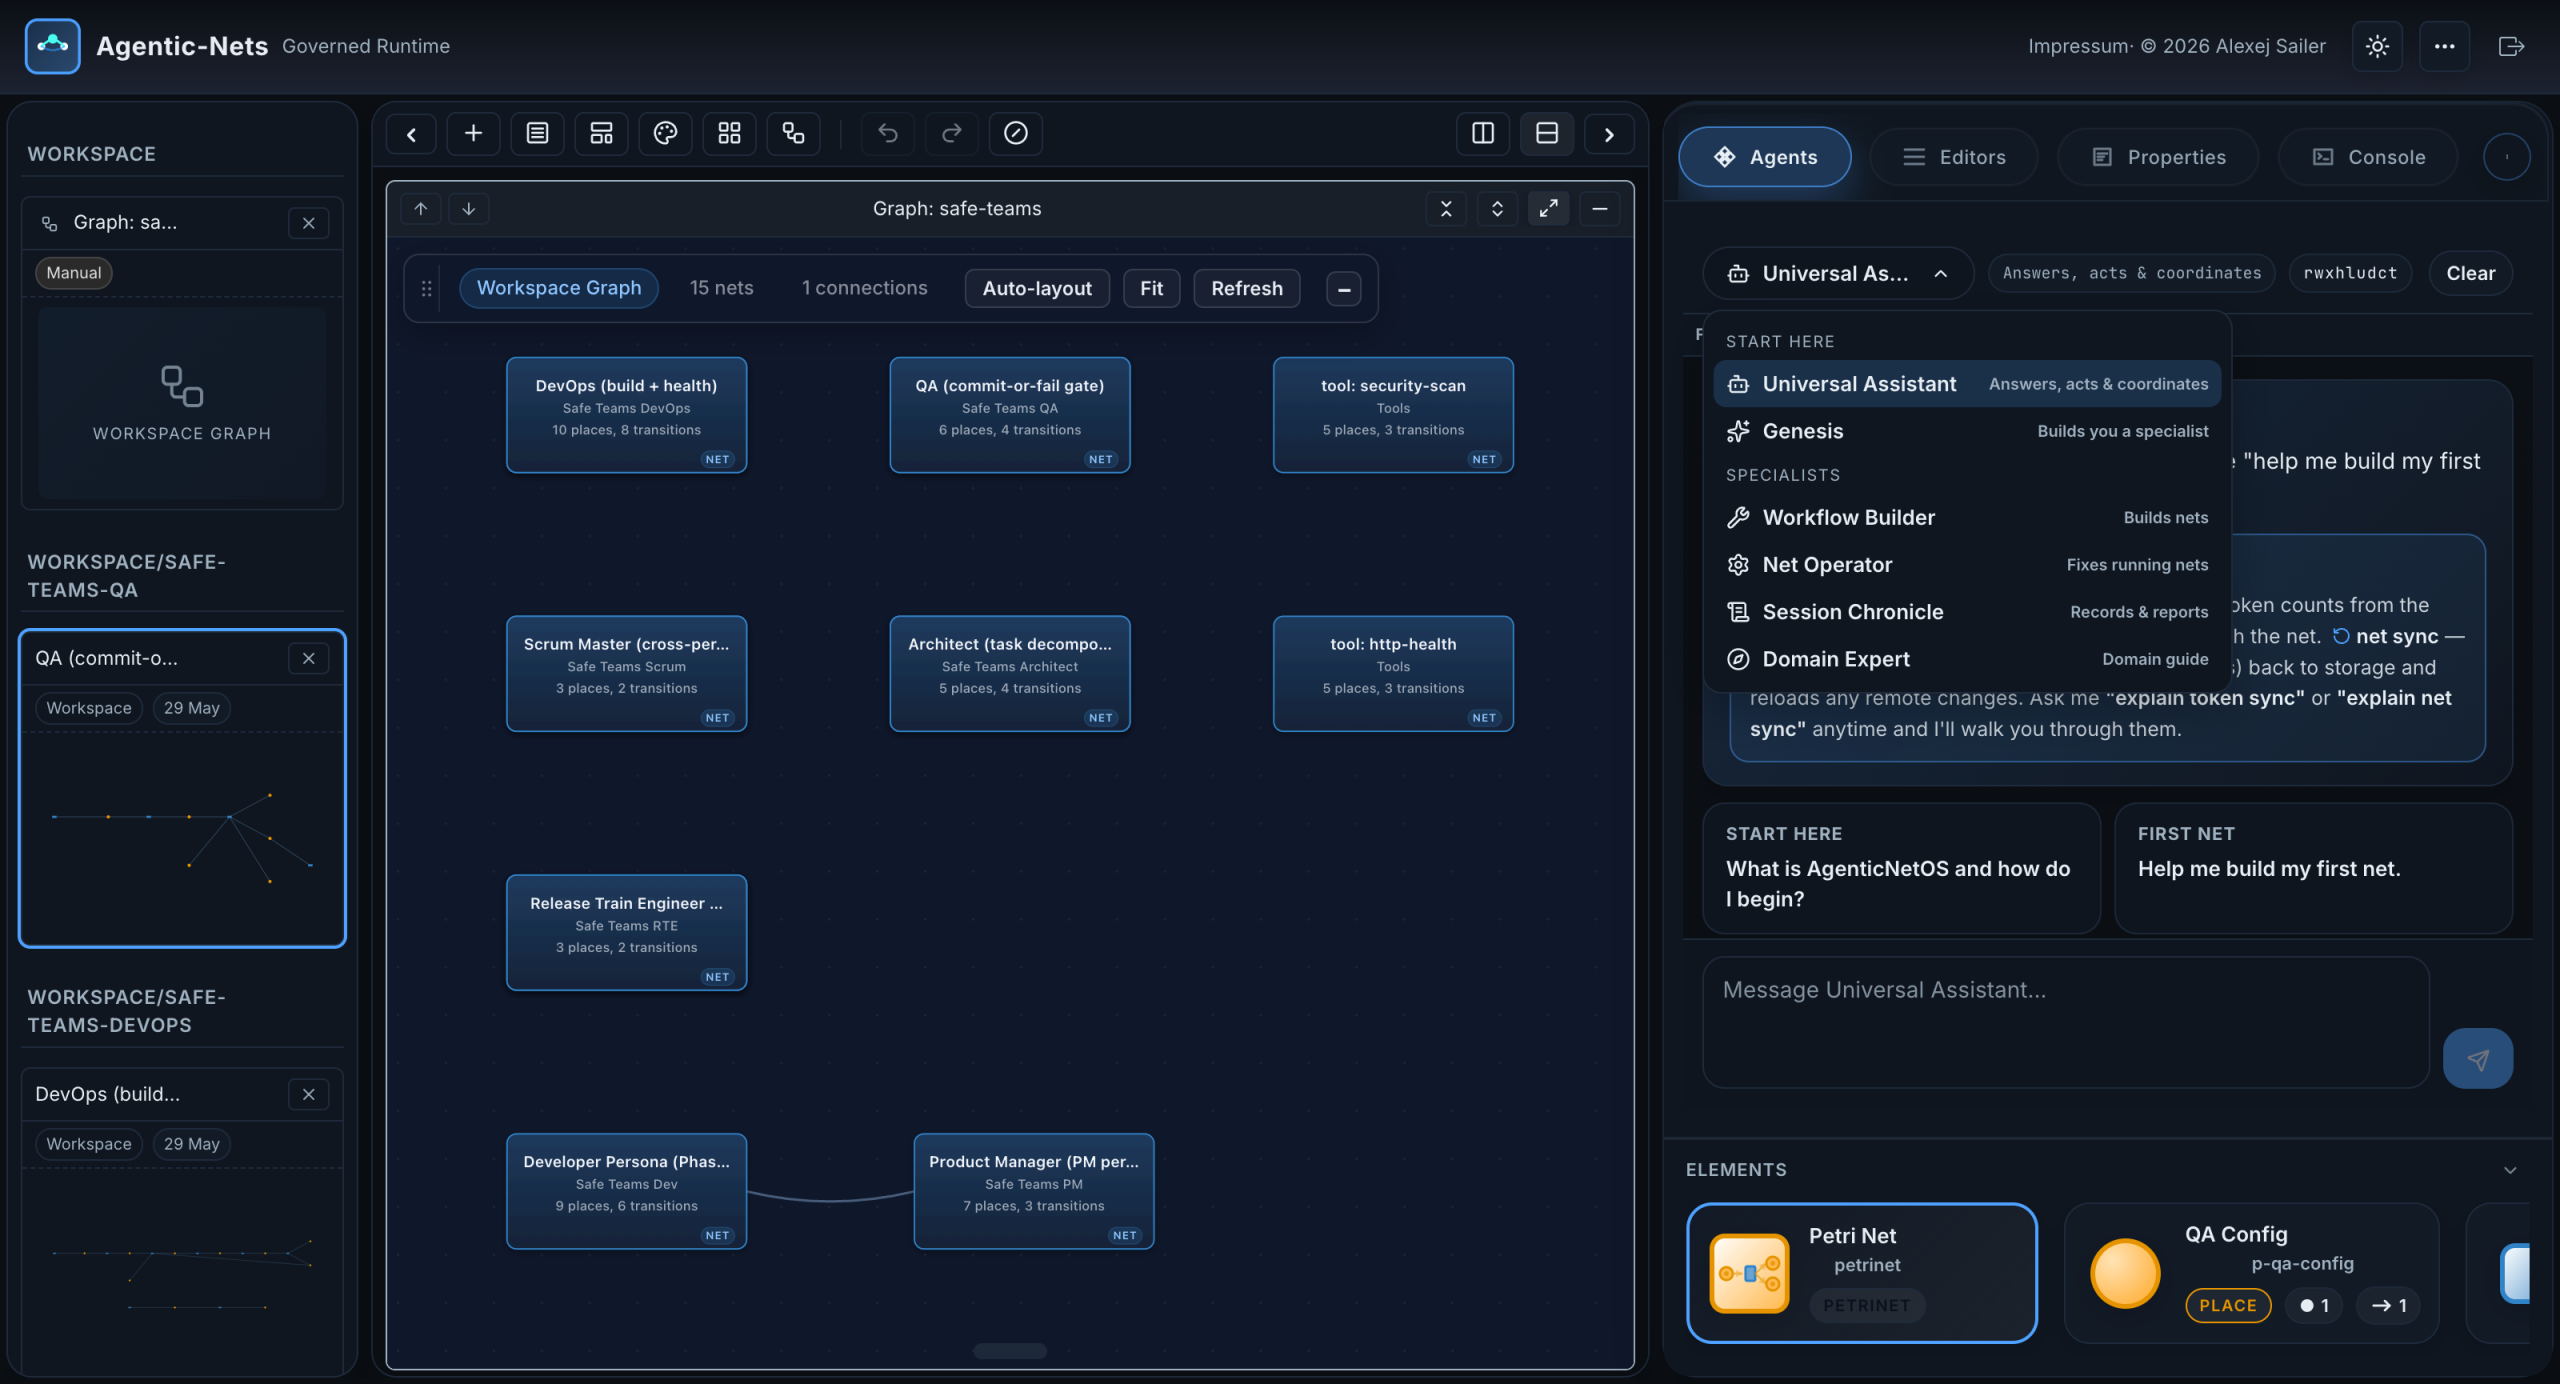
The persona menu shows the built-in specialists, each with a one-line capability hint. The Universal Assistant answers, acts and coordinates. Genesis builds you a custom specialist. The Workflow Builder designs nets. The Net Operator diagnoses and fixes running nets. The Session Chronicle records and reports. The Domain Expert explains whatever domain is currently in focus.
Next to the persona name you can see its capability string, for example rwxhludct: read, write, execute, http, logs, user, docker, coordinate, tooling. Nine independent flags define exactly which tools a persona may call, and the runtime enforces them at dispatch time. A read-only monitor persona physically cannot call a write tool, no matter what its prompt says. That is the permission model the dashboard promised in gap number four.
Step 10: Properties, the Operations View of One Transition
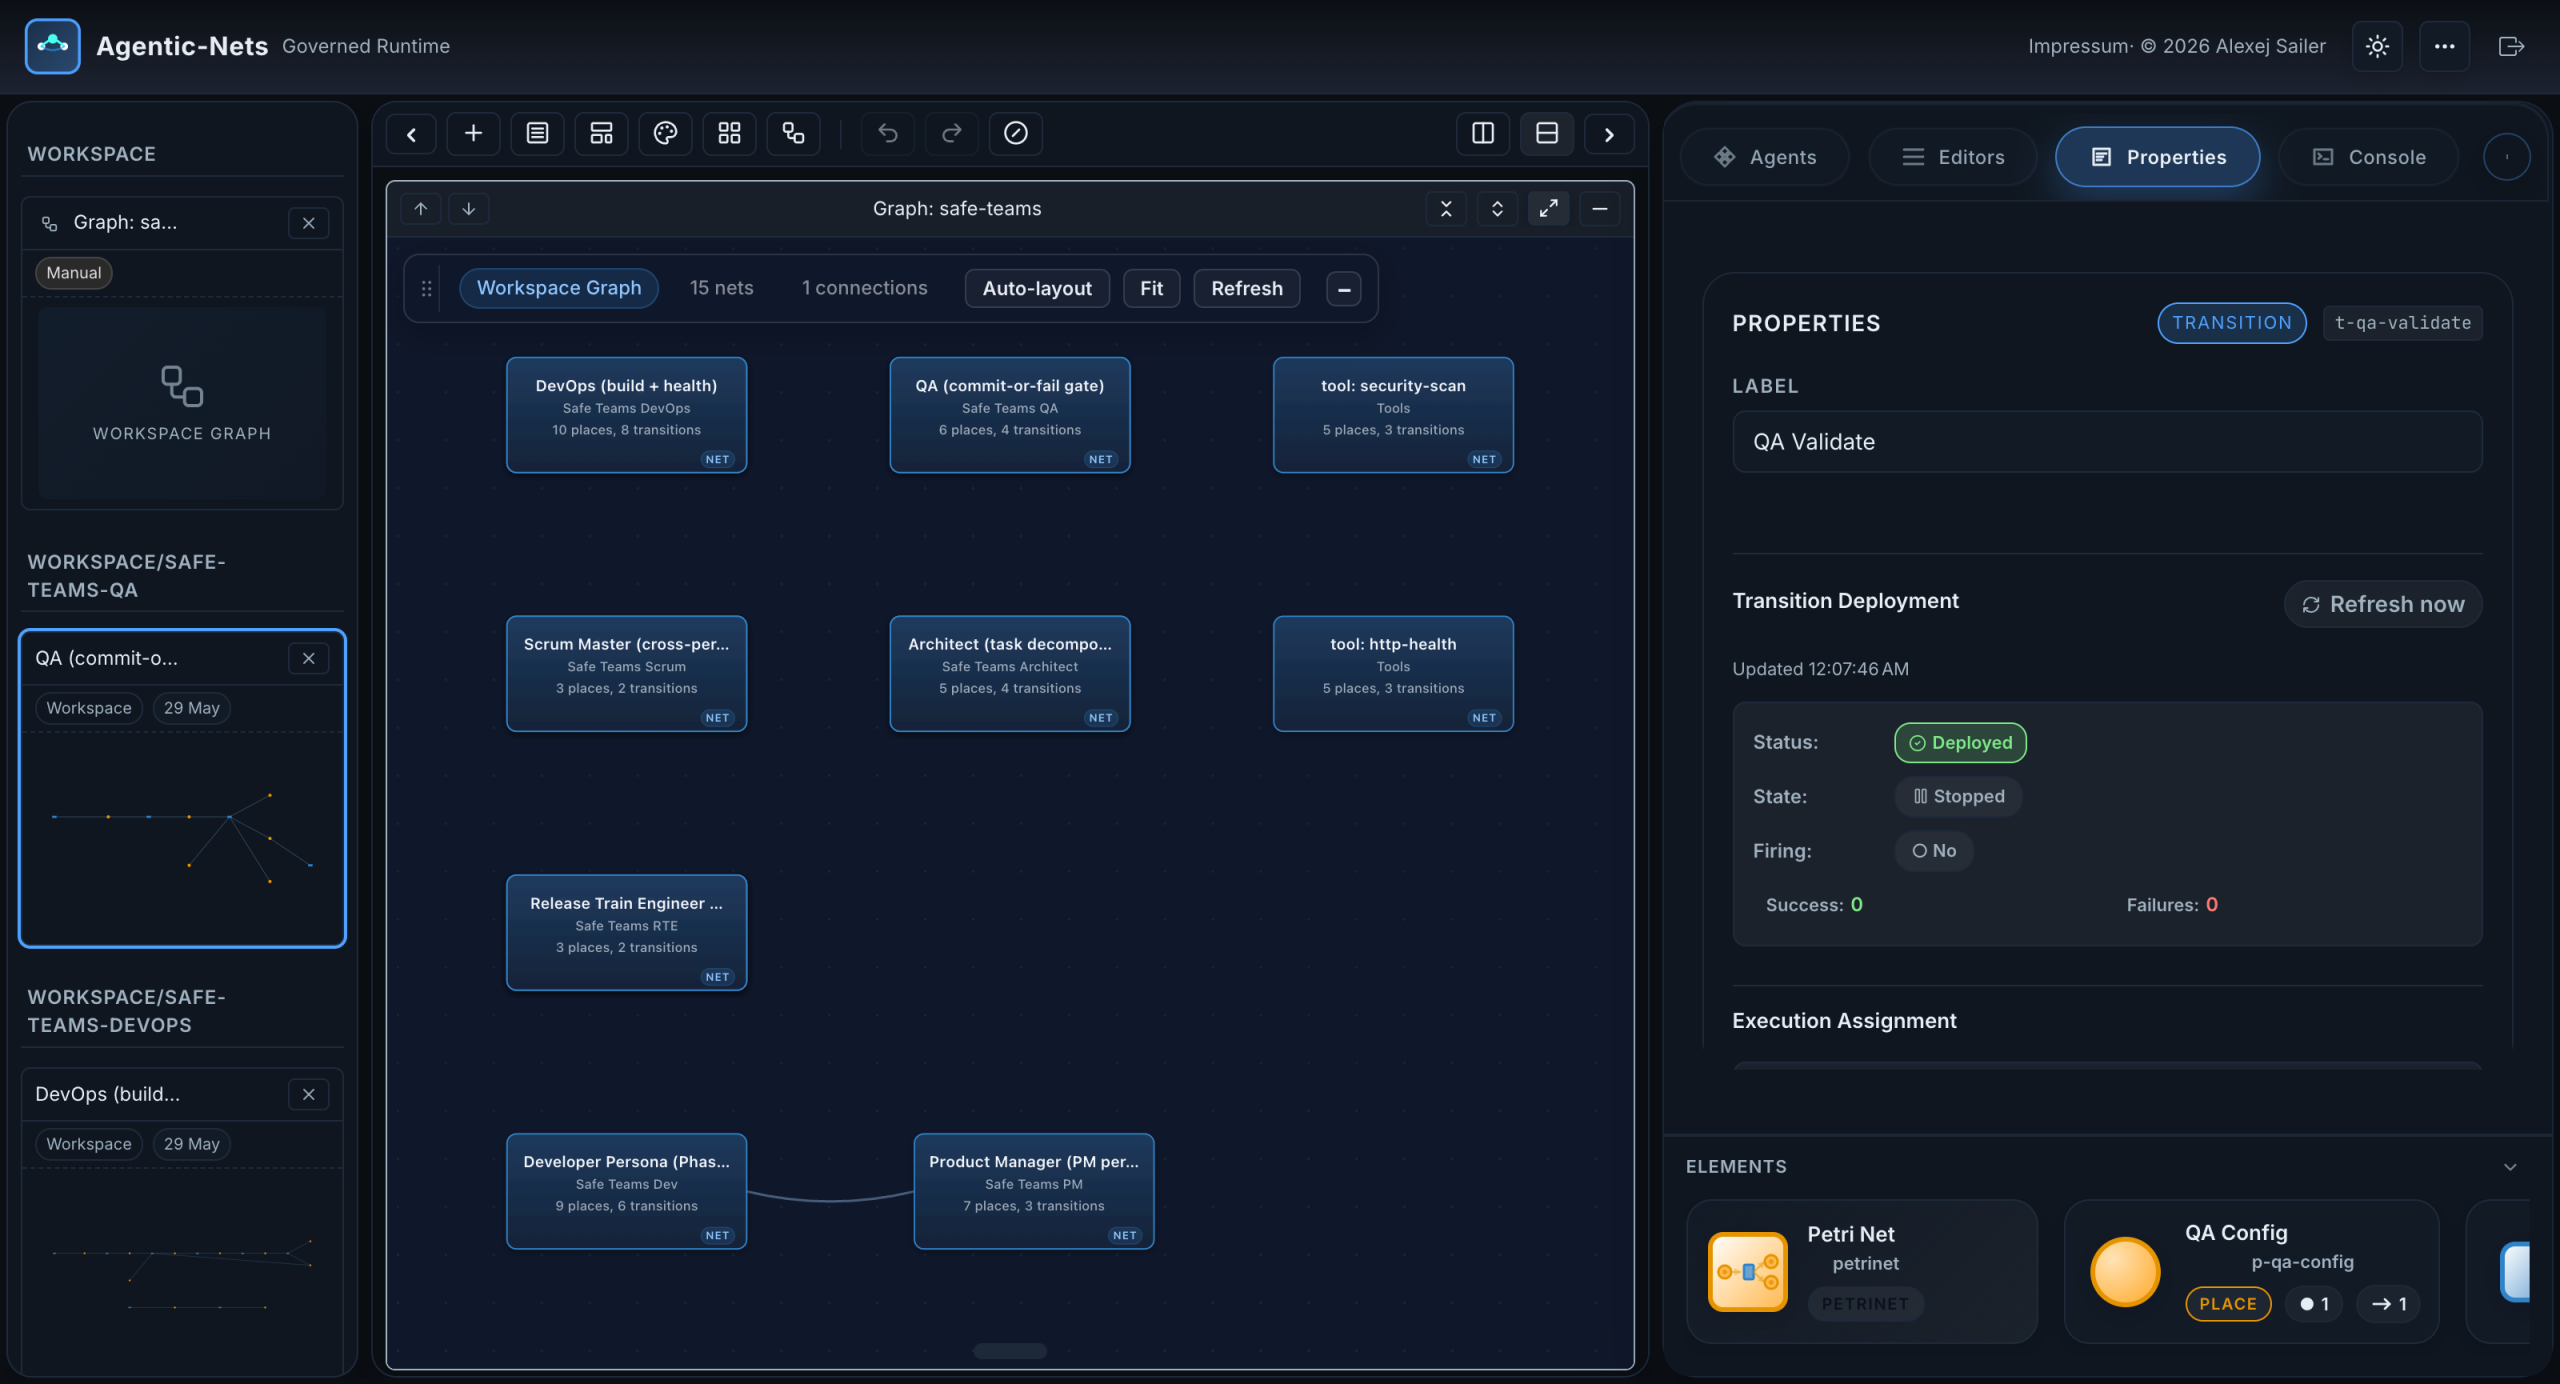
Selecting any element opens the Properties panel. For the QA Validate transition you see its label, its deployment status (deployed), its running state (stopped at the moment of the screenshot), whether it is currently firing, and live success and failure counters. From this panel you deploy a transition to an executor, start and stop its polling, or fire it once for a controlled test run.
Behind this panel is the transition lifecycle: undeployed, deployed, starting, running, stopped. Deployment means an executor has registered the transition and polls for work; the pull-based design means executors reach out over egress-only connections, which is what makes the execution boundary firewall-friendly.
Step 11: Models and Sessions
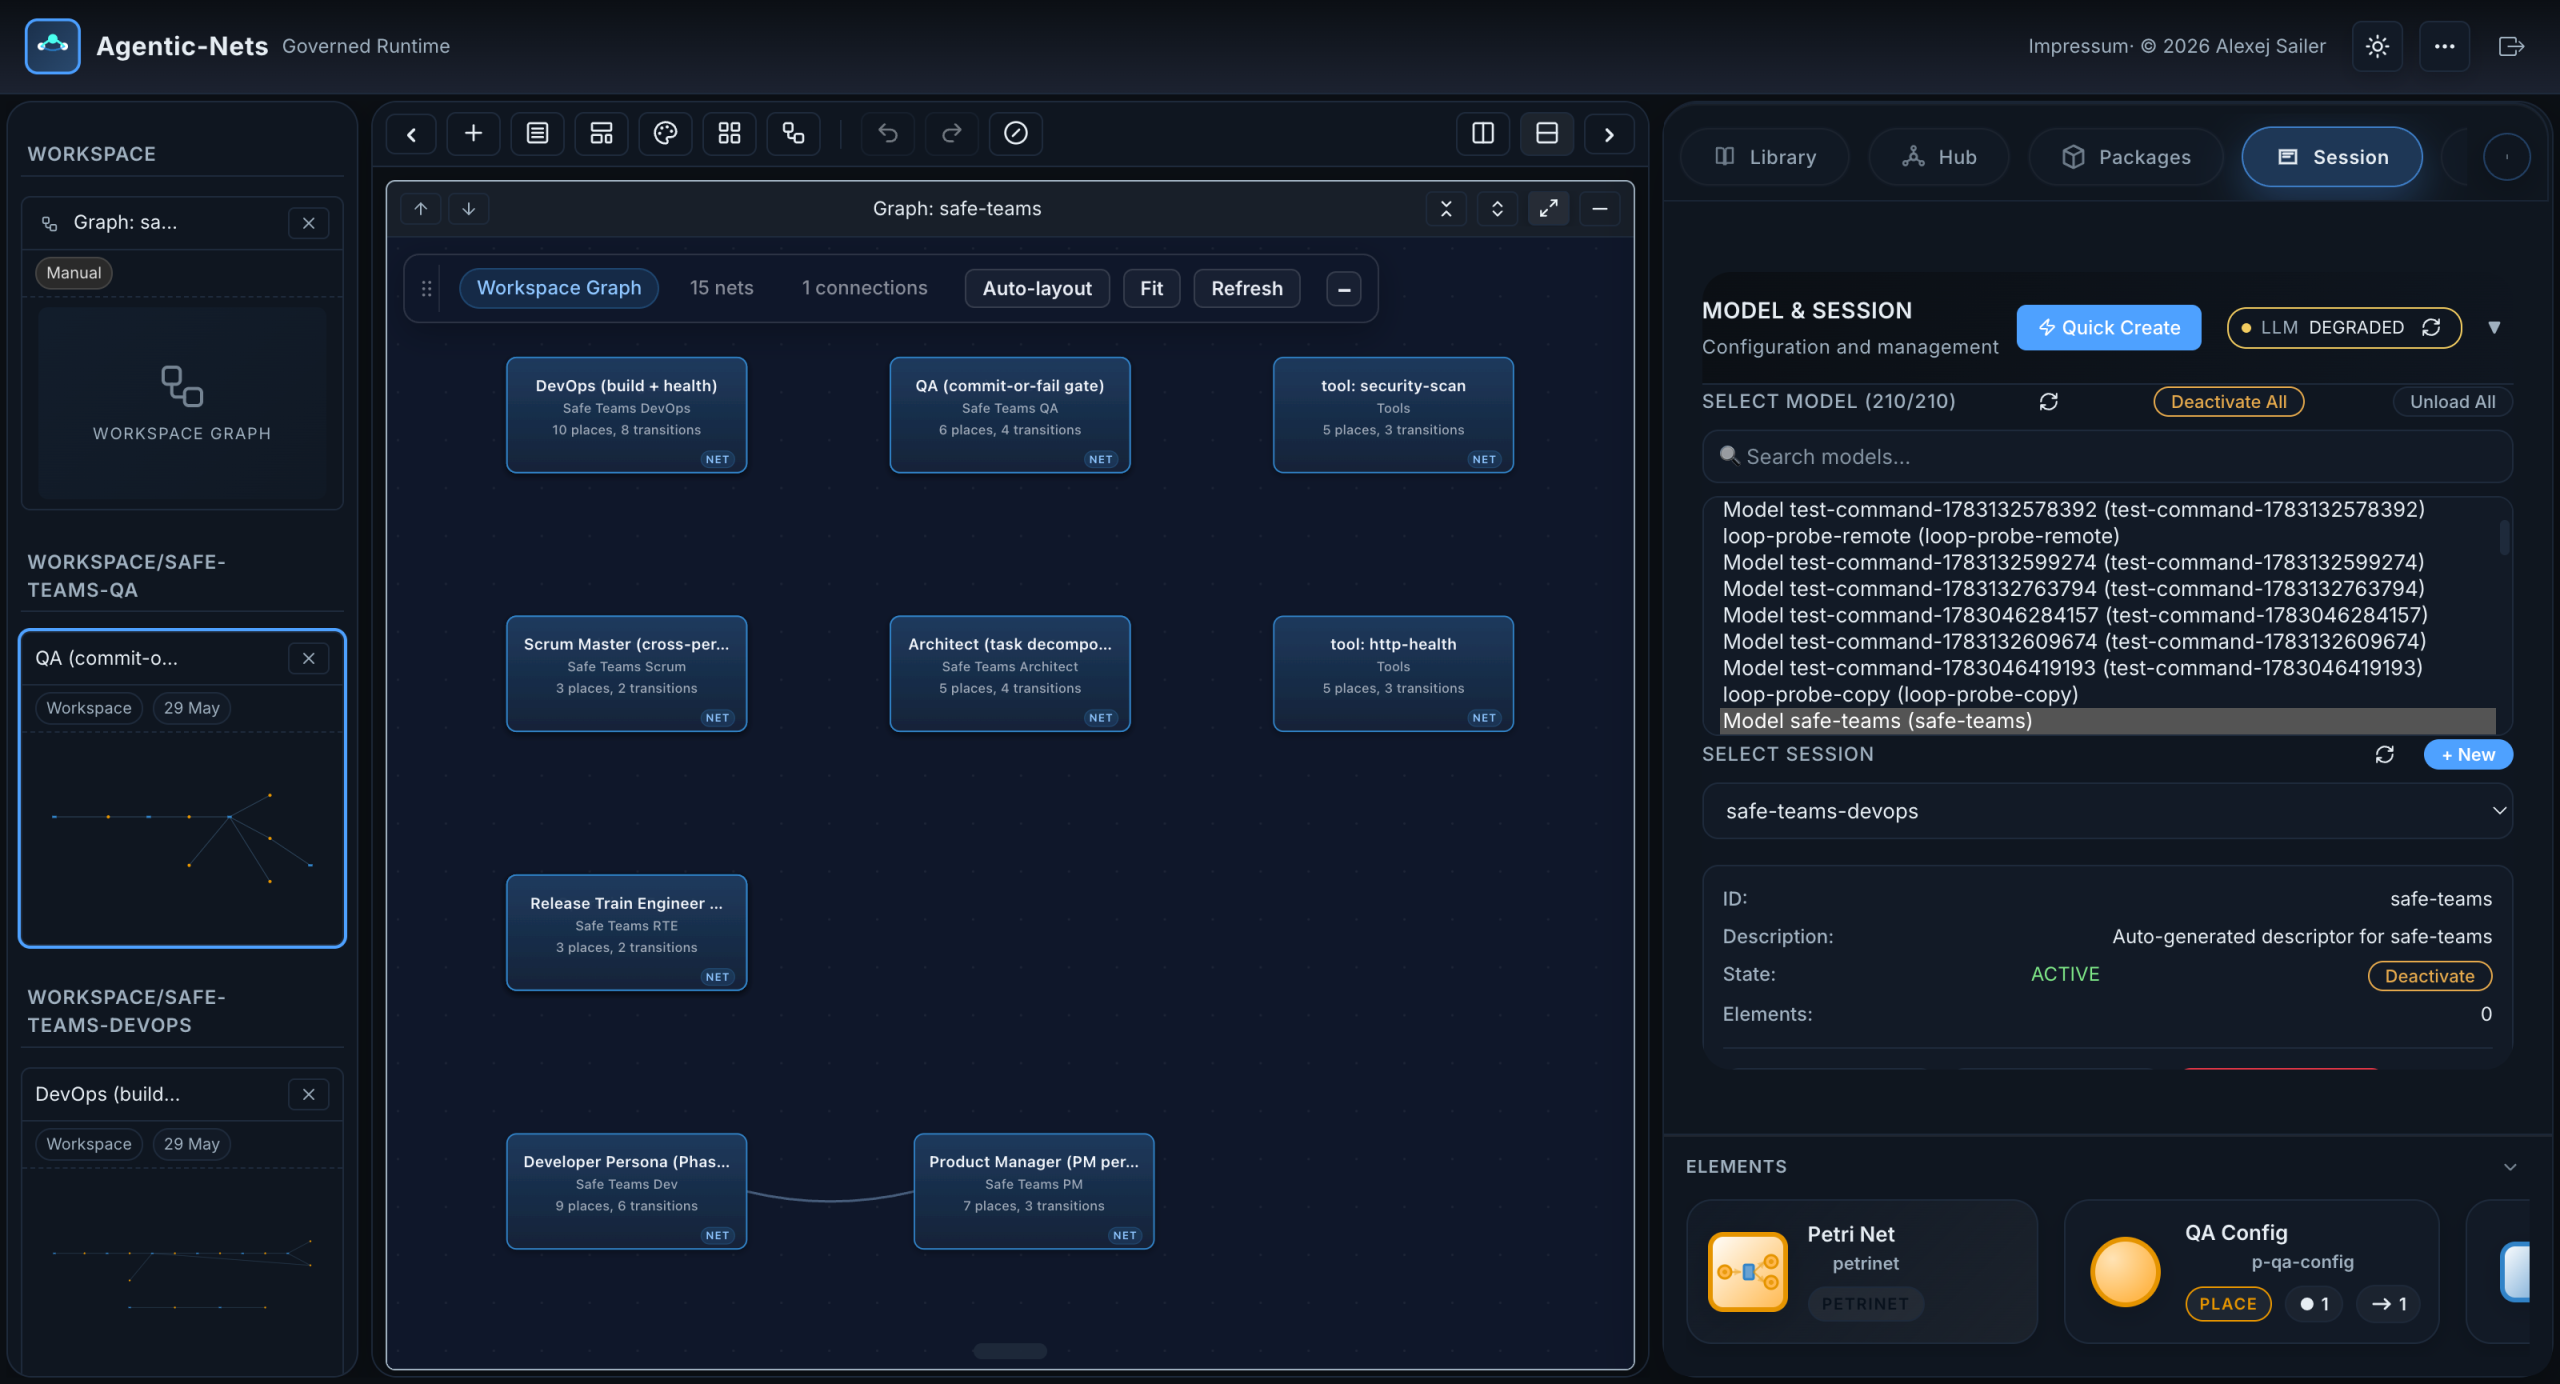
The Session panel is the workspace scoping tool. A model is an isolated, event-sourced database of nets, tokens, and history; a session groups the nets of one project or team inside a model. Here you configure the backend endpoints, watch service health, create models and sessions, or quick-create both with one click. Everything else in the Studio is scoped to what you select here, which is also how one deployment cleanly hosts many isolated projects.
Step 12: The Monitoring View, Watching Without Touching
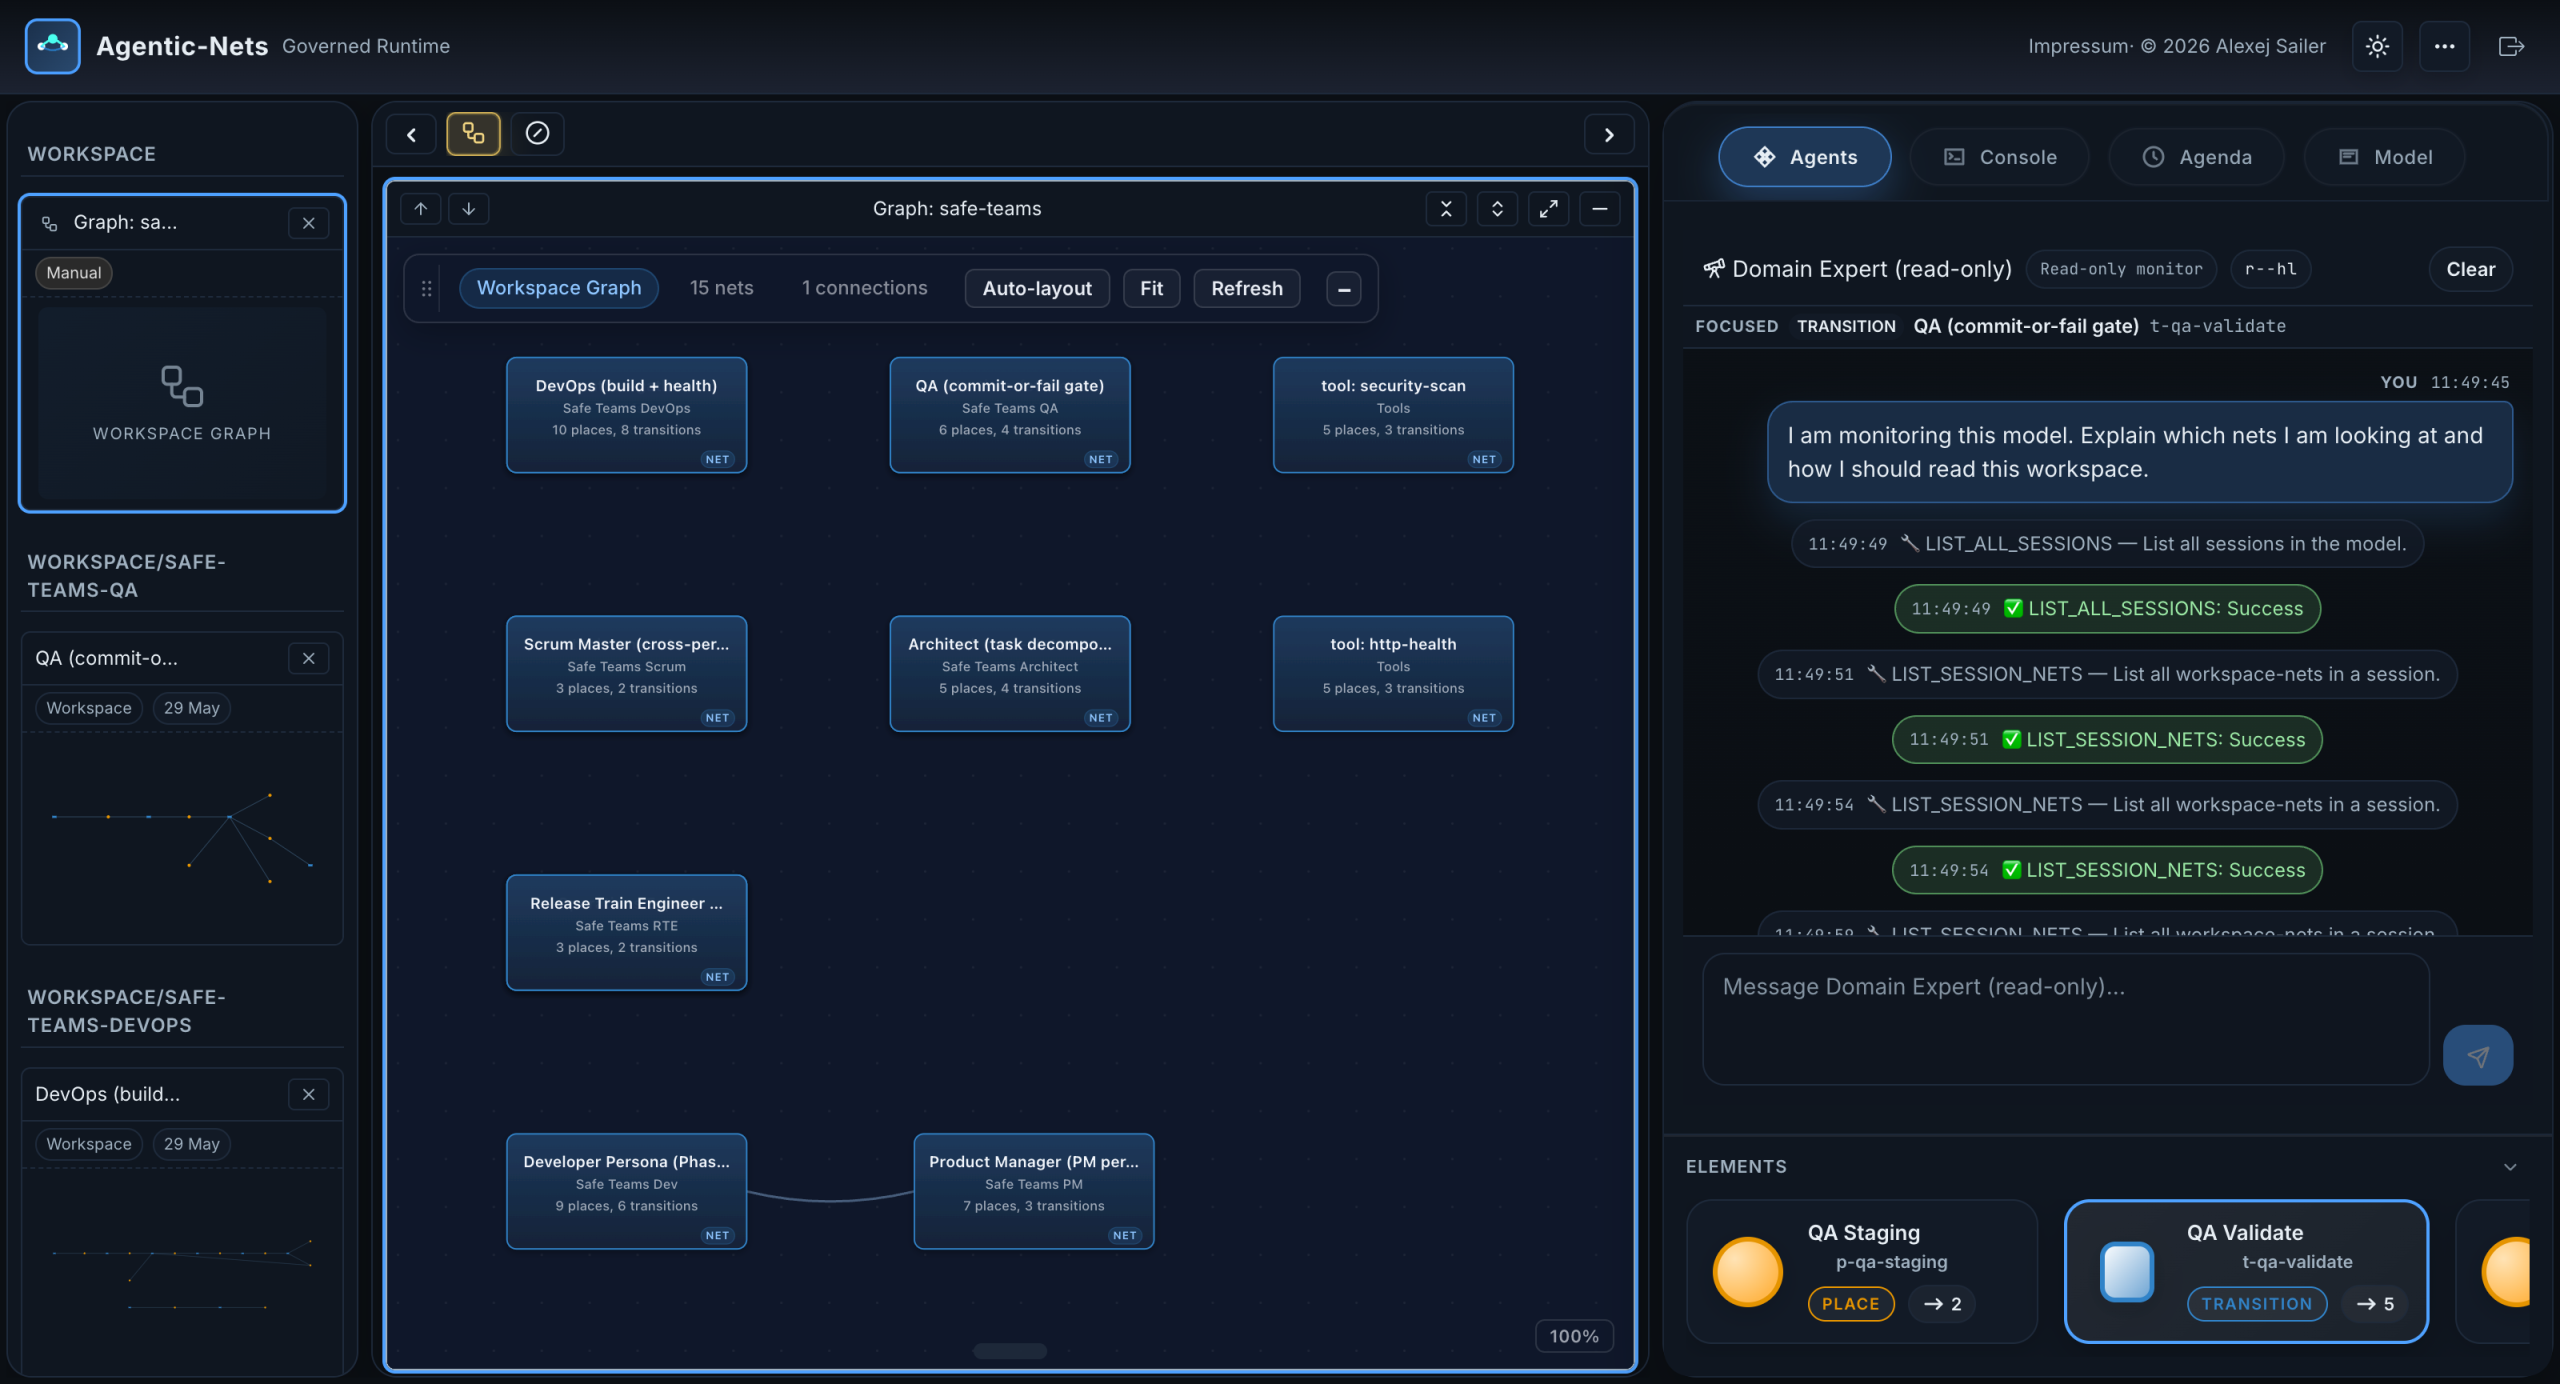
We end where governance pays off. This is the monitoring view, logged in with the read-only secret. It opens every net of the chosen session automatically and keeps token counts fresh. Notice what is missing: no create button, no delete, no inscription editing. Every write is rejected by the gateway for this session. This is how you give stakeholders, on-call operators, or an auditor a live window into a running multi-agent system without handing anyone the keys.
The Whole Tour as a Checklist
- Dashboard: the nine production gaps, Studio and Monitoring entries.
- Documentation: install, concepts, APIs, deployment; open without login.
- Login: admin secret or read-only secret; enforcement at the gateway.
- Studio layout: workspace list, editor tiles, tabbed sidebar.
- Workspace Graph: every net as a card, shared places as edges.
- A net up close: places, transitions, and routing as visible topology.
- Tile controls: token sync, net sync, commentary, PNML/PNG/PDF export.
- Universal Assistant: chat that acts, plus the element explorer.
- Personas: six specialists gated by rwxhludct capability flags.
- Properties: deploy, start, stop, fire once; live counters.
- Models and sessions: isolation and scoping for many projects.
- Monitoring view: the same system, read-only, safe to share.
Watch and Listen: the Narrated Tour
The narrated video walks the exact same steps with a voice track, so you can follow along while clicking through your own deployment. If you prefer audio only, the audiobook track covers the identical narration.
Try It Yourself
Everything in this tour runs locally. Clone the public repository at github.com/alexejsailer/agentic-nets, copy .env.template to .env, and start the stack:
git clone https://github.com/alexejsailer/agentic-nets
cd agentic-nets/deployment
cp .env.template .env
docker compose -f docker-compose.hub-only.yml up -d
Then open the dashboard, follow the install notes in the documentation hub, and ask the Universal Assistant to help you build your first net. The safe teams model you saw here is not a mockup; it is a running multi-agent team built entirely out of nets, and the same building blocks are waiting for your own process.